Electric Vehicle Fire Accident Graph - Market Status and Risk Management
RJ0800023_16
- Last Update 08/05/2025
- File Size 0.4MB
- # of Slides 2
- File Format PPTX
- Slide Ratio 16:9
- Color
Keywords
- #Content-Based Slides
- #Design-Based Slides
- #Market and Competitor Analysis
- #Risk Management and Regulatory Compliance
- #Graph
- #Market Status
- # Risk Management Strategy
- #Horizontal Bar
- #Horizontal Bar Chart
- #16:9
- #horizontal bar chart PowerPoint
- #bar graph slide template
- #data comparison chart
- #market analysis PPT
- #how to create bar chart in PowerPoint
About the Product
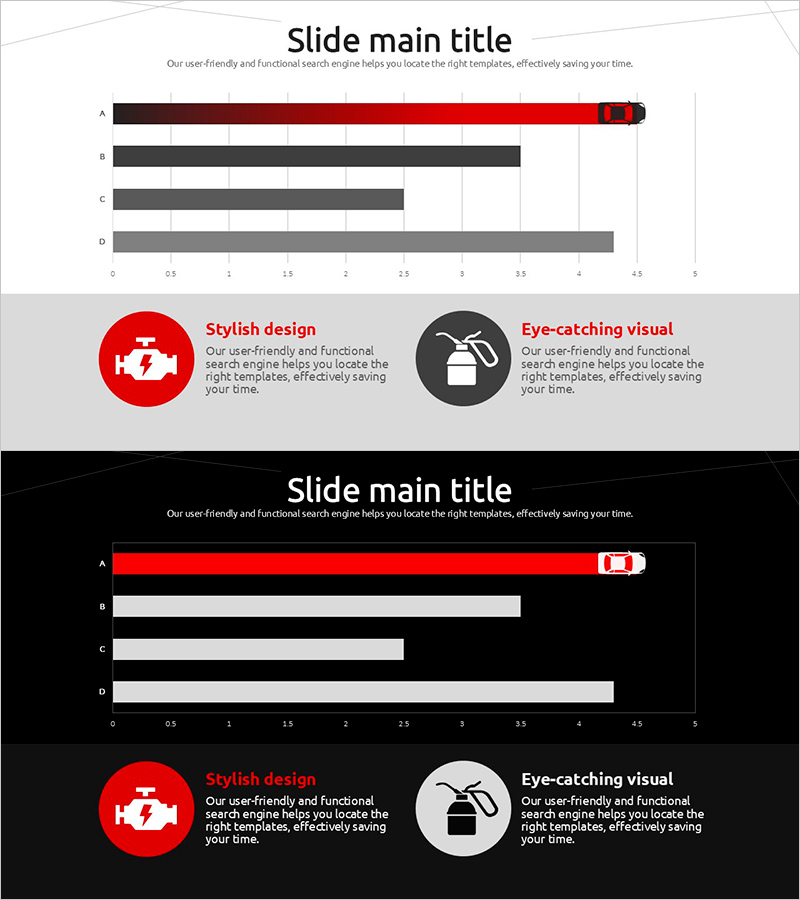
A horizontal bar chart PowerPoint slide designed to visualize electric vehicle fire accident data and market analysis. This presentation template features four comparable items (A through D) displayed as horizontal bars, with a red gradient accent bar contrasting against dark gray background bars to highlight key data. The slide structure clearly presents quantitative information for market status analysis, risk comparison, and accident trend reporting. Two design variations are included: a light background version for bright conference rooms and online presentations, and a dark background version for large auditoriums and projector environments. Fully editable and ready to use in business reports, data presentations, and strategic planning documents.
Usage Points
-
Main Usage
This slide effectively compares and analyzes quantitative data across four or more items in a horizontal layout. Ideal for presenting electric vehicle fire statistics, market size comparisons, risk assessments, sales trends, and performance metrics. The red gradient accent bar draws attention to the top-ranked item, ensuring audience focus on critical data points.
-
How to Use
Adjust each bar length to reflect actual data values and replace A, B, C, D labels with your item names. Use the light background version for bright meeting rooms and virtual presentations, and the dark background version for large auditoriums and projection environments. Colors and numerical values are fully customizable to match your corporate branding guidelines.
-
Recommended For
Recommended for executive reports, market analysis presentations, risk management briefings, business performance evaluations, and industry trend analysis. Ideal for finance, energy, automotive, and insurance professionals, data analysts, management consultants, and policy makers who need to present quantitative evidence and comparative data.
-
Slide Structure
Two-slide set with identical layouts in different color schemes. Slide 1 features a light background (white base with black and dark gray bars, red accent). Slide 2 features a dark background (black base with white and light gray bars, red accent). Each slide includes a title area, four horizontal bars representing data items, a numerical axis (0-5 range), and a legend area for clear data interpretation.
Related Products
-

Meat and Vegetable Consumption by Region – Market Status Analysis
#Market and Competitor Analysis #Graph #Other
-

Global Market Future Outlook Chart – Forward-Looking Business Analysis
#Market and Competitor Analysis #Graph #Market Status
-

Sports Analysis Bar Chart – Easy Performance Monitoring Option
#Business Strategy #Market and Competitor Analysis #Graph
-

Medical Services Characteristics Connection Diagram
#Market and Competitor Analysis #Graph #Market Status
