Climbing and Physical Strength Graph – Visualizing Market Analysis Results
RJ0800021_9
- Last Update 08/05/2025
- File Size 5.3MB
- # of Slides 2
- File Format PPTX
- Slide Ratio 16:9
- Color
Keywords
About the Product
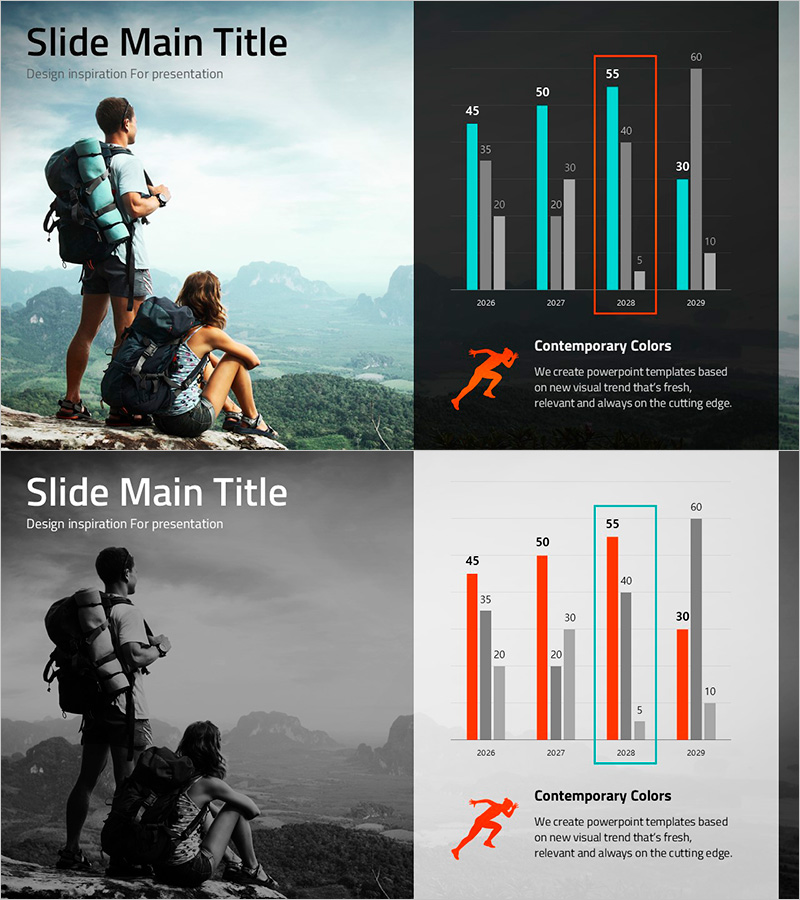
A 2-slide PowerPoint presentation featuring grouped bar charts comparing data trends from 2028 to 2029 across four years. Design 1 uses a dark background with cyan and gray bars, while Design 2 applies an orange and gray color scheme on a light background. Each year displays three data series side by side for intuitive comparison. A highlighted box emphasizes the peak value of 55, and an orange running icon symbolizes performance growth. These slides are ready to integrate into business reports, quarterly performance presentations, and marketing strategy documents for data visualization and analysis sections.
Usage Points
-
Main Usage
Visualize multi-series annual data using grouped bar charts to compare performance trends and highlight peak achievements. Two design options (dark and light backgrounds) allow flexible adaptation to different presentation environments and document styles.
-
How to Use
Insert into business reports, quarterly performance reviews, or marketing strategy presentations to display year-over-year comparisons and data priorities. The bar heights, colors, and highlight box draw attention to key performance metrics and critical data points.
-
Recommended For
Sales, marketing, and business planning professionals presenting quarterly or annual performance results to executives and clients. Ideal for market analysis, competitive benchmarking, and data-driven decision-making presentations.
-
Slide Structure
Slide 1 (dark background): 4 years (2028–2029), 3 data series per year (cyan and gray bars), Y-axis scale 0–60, peak value 55 with highlight box, orange running icon. Slide 2 (light background): identical data structure with orange and gray color scheme optimized for light backgrounds. 16:9 aspect ratio, PPTX format.
Related Products
-

Vertical Bar Chart Slide for Effective Data Visualization
#Market and Competitor Analysis #Graph #Competitor Analysis
-

Regional Competitive Advantage Chart – Essential Tool for Market and Competitor Analysis
#Company Introduction #Market and Competitor Analysis #Graph
-

PC Mockup & Column Bundle Graph
#Market and Competitor Analysis #Graph #Other
-

Sales & Performance Status Slide – Data-Driven Insights
#Company Introduction #Market and Competitor Analysis #Diagram
