Cover Slide for Numerical Analysis by Customer Insights
RJ0800021_4
- Last Update 08/05/2025
- File Size 1.4MB
- # of Slides 2
- File Format PPTX
- Slide Ratio 16:9
- Color
Keywords
- #Content-Based Slides
- #Design-Based Slides
- #Market and Competitor Analysis
- #Graph
- #Customer Analysis
- #Horizontal Bar
- #Segmented Horizontal Bar
- #16:9
- #horizontal bar chart PowerPoint
- #customer analysis presentation slide
- #numerical comparison graph
- #market analysis PowerPoint template
- #how to create bar chart in PowerPoint
About the Product
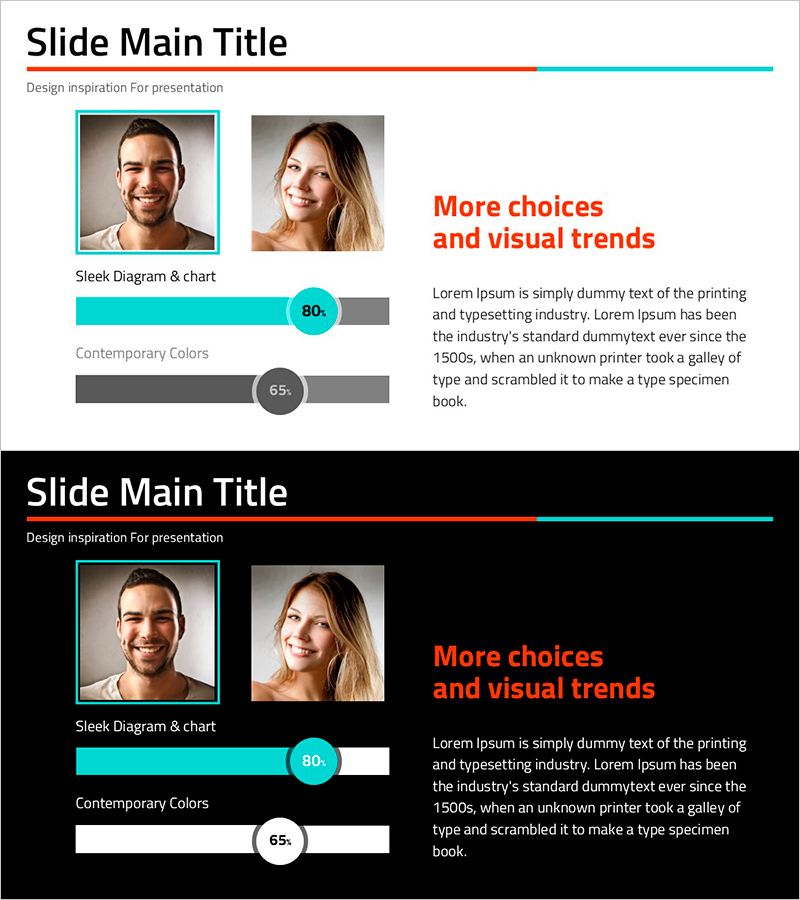
A horizontal bar chart PowerPoint slide for visualizing customer-level market analysis data. The design features a turquoise and gray two-tone bar chart displaying 80% and 65% numerical comparisons, paired with profile images to showcase customer segment performance metrics at a glance. The 2-slide set includes a cover slide and a data visualization slide in 16:9 widescreen PPTX format, ready for immediate editing and presentation use. Ideal for marketing reports, sales presentations, and customer analysis briefings.
Usage Points
-
Main Usage
Visualize customer segment performance metrics, market share, and sales comparisons using horizontal bar charts to present data-driven decision-making insights. The turquoise accent color and gray background create strong contrast to highlight key figures, while profile images reinforce customer-centric analysis context.
-
How to Use
Edit the cover slide title and subtitle, then modify bar lengths, numerical values, and labels on the data slide to match your analysis results. Replace profile images with actual customer photos and add descriptive text to emphasize customer characteristics. Colors and fonts can be adjusted to align with corporate branding.
-
Recommended For
Marketing managers, sales directors, and executives presenting customer analysis findings in business meetings. Suitable for quarterly performance reviews, customer satisfaction survey results, competitive market analysis, and product-level sales comparisons requiring data-backed decision support.
-
Slide Structure
Slide 1: Title cover (headline, subtitle, design accent lines). Slide 2: Horizontal bar chart data visualization (2 profile images + turquoise and gray two-tone bars + 80% and 65% numerical indicators + descriptive text). 16:9 widescreen format, PPTX file.
Related Products
-

People Silhouette and Comparison Graph – Data Visualization for Customer Analysis
#Market and Competitor Analysis #Graph #Other
-

Study Image and Horizontal Segmentation Bar Graph - Customer Analysis and Market Trends
#Market and Competitor Analysis #Graph #Customer Analysis
-

Financial Plans and Performance Presentation Template – Professional and Reliable Design
#Market and Competitor Analysis #Financial Plans and Performance #Graph
-

User Analysis Status by Year – Growth and Change
#Product/Service Introduction #Market and Competitor Analysis #Graph
