Demand Analysis for Interior Furniture Presentation Slide
RJ0900023_26
- Last Update 08/23/2025
- File Size 0.3MB
- # of Slides 2
- File Format PPTX
- Slide Ratio 16:9
- Color
Keywords
About the Product
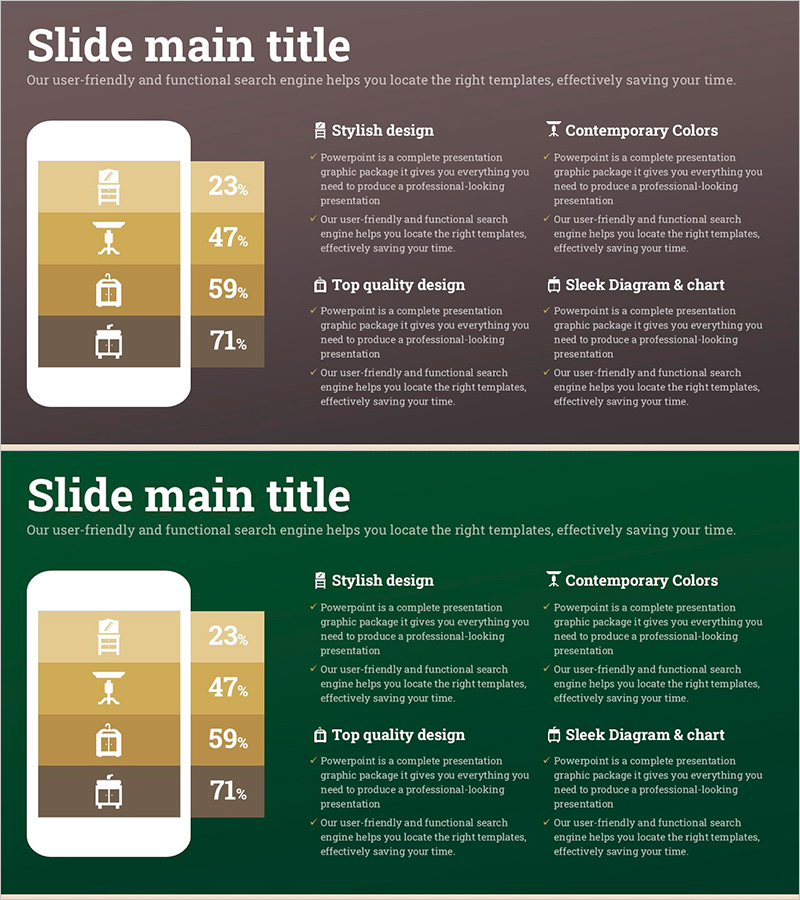
An infographic-based PowerPoint slide designed for market analysis and demand assessment. This 2-slide set visualizes four key metrics using icons and percentage figures against a warm brown and beige background with white typography. The layout features a vertical icon list on the left and descriptive text area on the right, clearly separating information for effective data communication. Ideal for presenting market insights, competitive analysis, and business metrics in corporate presentations, investor pitches, and marketing strategy meetings. Available in 16:9 widescreen PPTX format, fully editable and ready to use.
Usage Points
-
Main Usage
Visualize market data, demand metrics, and competitive analysis using icons and percentage figures to support decision-making. The 4-item comparison structure enables stakeholders to grasp key insights at a glance, making it ideal for presentations to investors, executives, and marketing teams.
-
How to Use
Enter analysis category names in the left icon area and corresponding descriptions with numerical data in the right text boxes. Customize the brown and beige color scheme to match your corporate branding, and replace icons to align with your analysis theme. The 2-slide format allows you to present multiple analysis topics sequentially.
-
Recommended For
Recommended for business plans, marketing strategy documents, and investor pitch decks requiring market analysis, demand assessment, and competitive comparison. Particularly valuable for industries such as interior design, furniture, consumer goods, and retail where data-driven decision-making is critical.
-
Slide Structure
2-slide set with each slide divided into left vertical icon list (4 items) and right text area. Each item includes icon, category name, percentage figure, and descriptive text, creating a clear information hierarchy optimized for comparative analysis.
Related Products
-

Residential Lighting Graph – Market Analysis
#Market and Competitor Analysis #Graph #Other
-

Wedding Preparation Progress Scale Slide – Visualization of Market Status
#Market and Competitor Analysis #Graph #Other
-

Survey Graph of Quality of Life Satisfaction by Living Environment – Market Analysis Slide
#Market and Competitor Analysis #Graph #Other
-

Visualizing Bar Graphs with PC Mockups – Competitive Market Analysis Tool
#Market and Competitor Analysis #Graph #Other
