Simple Mixed Rounded Vertical Bar Graph – Intuitive Representation of Market Status
RJ0500007_25
- Last Update 06/09/2025
- File Size 1.2MB
- # of Slides 2
- File Format PPTX
- Slide Ratio 16:9
- Color
Keywords
About the Product
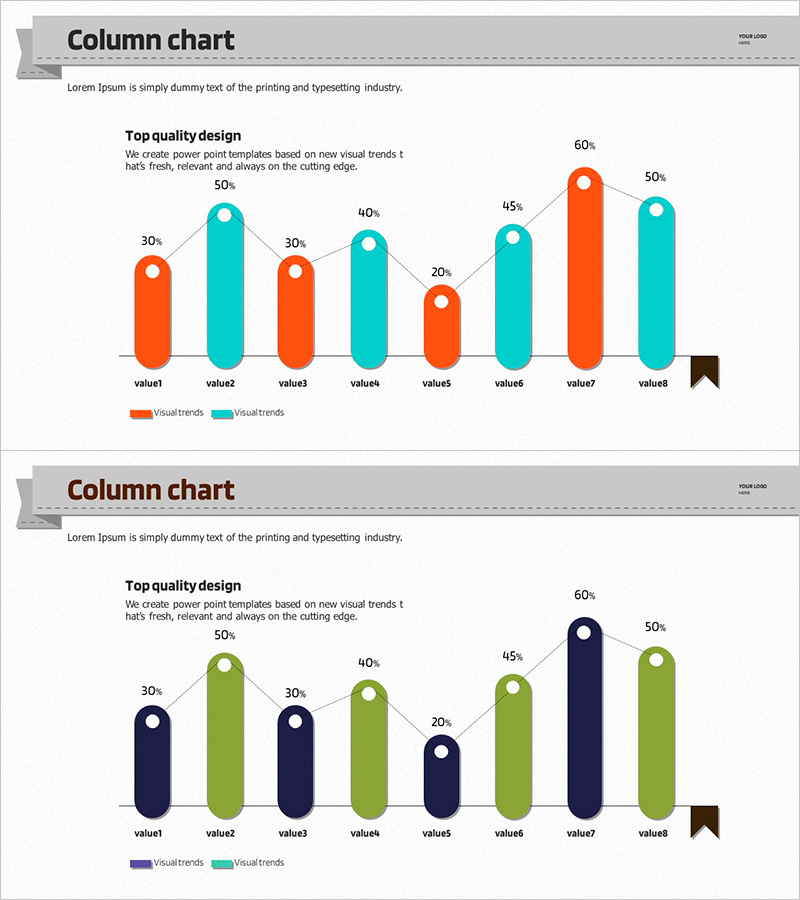
A mixed vertical bar chart PowerPoint slide designed for market analysis and competitive comparison. This presentation template displays two data series (orange and teal) across eight data points, with percentage values and circular markers clearly indicating each value. The 16:9 widescreen format includes two slides ready for immediate use in market share analysis, competitor benchmarking, sales trend reports, and business performance presentations. Editable title and description areas allow customization for your specific presentation context, making it ideal for company profiles, marketing plans, and business reports.
Usage Points
-
Main Usage
Visualize quantitative market data, competitive comparisons, and sales trends using a dual-series bar chart format. The percentage values and circular markers emphasize each data point, providing clear evidence for strategic decision-making and stakeholder communication.
-
How to Use
Edit the title and description text to match your analysis topic and key insights. Replace the bar heights and percentage values with your actual data. Use this slide in market analysis sections of company presentations, competitive analysis in marketing plans, or performance comparisons in quarterly business reports.
-
Recommended For
Marketing professionals, business analysts, and executives presenting market data and performance metrics. Particularly useful for new business proposals, investor pitch decks, quarterly performance reviews, and competitive strategy discussions where data-driven insights are essential.
-
Slide Structure
Two-slide set featuring a title area, descriptive text section, and mixed vertical bar chart. The chart displays eight data categories (value1 through value8) with dual-series bars in orange and teal, each topped with percentage values and circular markers for enhanced readability and data emphasis.
Related Products
-

Hiking Illustration Icons and Volume Charts – Market Analysis Slide
#Market and Competitor Analysis #Graph #Other
-

Market Analysis Graph for Mobile Networks
#Market and Competitor Analysis #Graph #Other
-

Regional Outlook Graph – Visualizing Market Status
#Market and Competitor Analysis #Graph #Other
-

Idea Presentation Template Wide – Market Analysis and Visualization
#Market and Competitor Analysis #Graph #Other
