Running Face Measurement Table – Visualizing Fitness Data
RJ0800021_11
- Last Update 08/05/2025
- File Size 1MB
- # of Slides 2
- File Format PPTX
- Slide Ratio 16:9
- Color
Keywords
- #Content-Based Slides
- #Design-Based Slides
- #Product/Service Introduction
- #Financial Plans and Performance
- #Diagram
- #Other
- #Features
- #Key Financial Indicators
- #Table
- #Standard Table
- #Silhouette
- #16:9
- #running silhouette PowerPoint slide
- #fitness data measurement table
- #exercise performance presentation
- #health data visualization template
- #silhouette slide design
About the Product
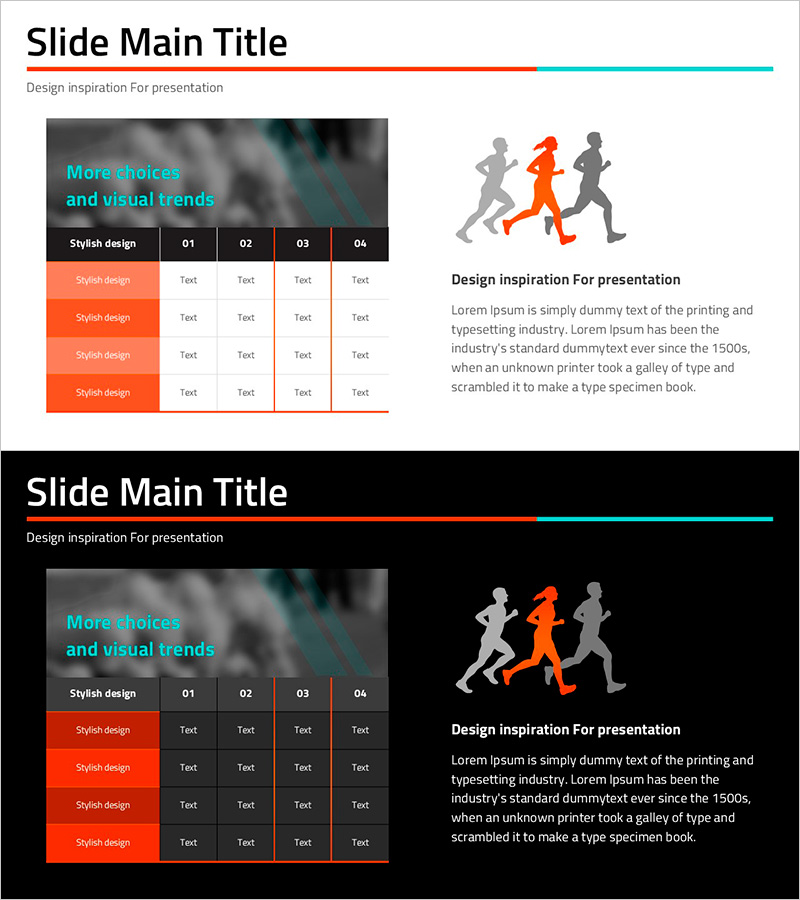
A fitness data visualization PowerPoint slide featuring running silhouettes with an integrated measurement table. The design highlights an orange-accented center runner silhouette against gray background runners, creating strong visual contrast. The left side contains a 5-row data entry table for recording fitness metrics, while the right side displays the silhouette composition. Provided in 16:9 aspect ratio with 2 slides in both white and black background versions. Ideal for fitness program reports, athletic performance presentations, and health data analysis discussions.
Usage Points
-
Main Usage
Present fitness program results, report exercise performance metrics, and communicate health management project progress. The combination of silhouette imagery and data table enables intuitive delivery of quantitative fitness information to audiences.
-
How to Use
Enter measurement item names and numerical data into the 5-row table on the left side. Add supplementary text or icons to the right silhouette area as needed. Select either white or black background version based on your presentation environment.
-
Recommended For
Fitness trainers, sports scientists, health managers, and exercise program coordinators presenting performance data. Suitable for corporate wellness program presentations, athletic achievement reports, and personal fitness goal progress sharing.
-
Slide Structure
2-slide set with consistent layout. Each slide features a 5-row by 5-column data table (6 rows including header) on the left, and running silhouettes on the right with orange-highlighted center runner and gray background runners. Title area at top and descriptive text area at bottom.
Related Products
-

Minimal Block Table for Revenue and Profit Analysis – Emphasizing Financial Performance
#Financial Plans and Performance #Diagram #Sales and Revenue
-

Innovative Chart Slide Featuring AI Theme
#Financial Plans and Performance #Diagram #Income Statement
-

Blue Green Climbing Table Chart – Visualization of Financial Performance
#Financial Plans and Performance #Diagram #Sales and Revenue
-

Key Financial Indicators for Animal Nature Conservation Programs – Effective Budget Management
#Financial Plans and Performance #Diagram #Budget
