Key Financial Indicators for Animal Nature Conservation Programs – Effective Budget Management
RJ0600074_26
- Last Update 07/09/2025
- File Size 3.1MB
- # of Slides 2
- File Format PPTX
- Slide Ratio 16:9
- Color
Keywords
About the Product
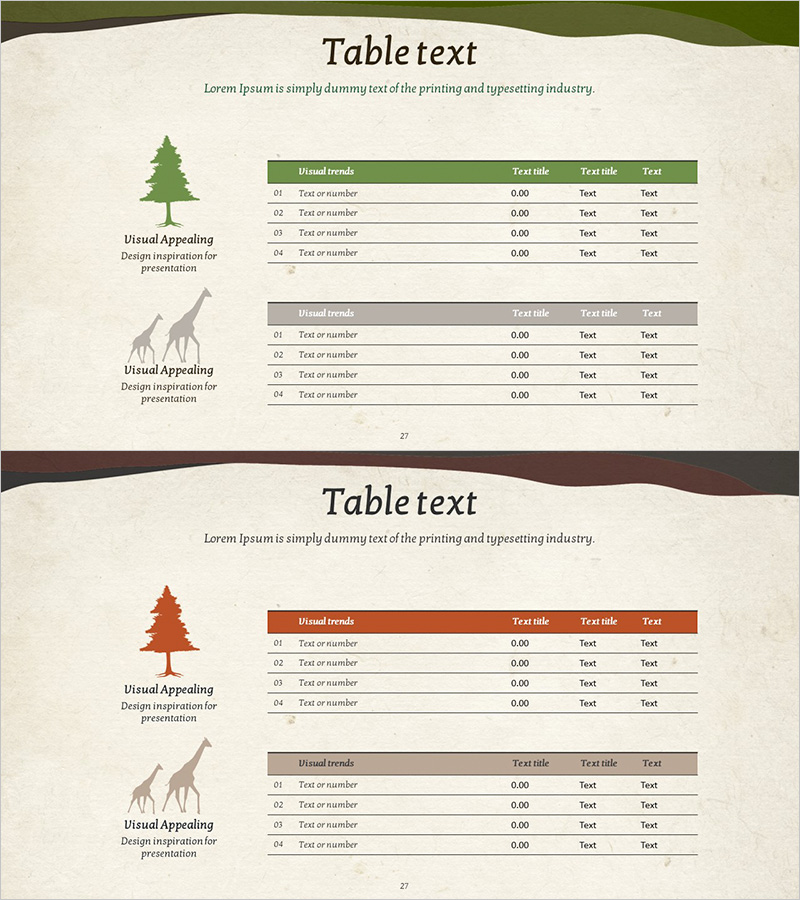
A PowerPoint presentation slide designed to organize and compare financial metrics for animal conservation programs. The slide features two data tables with green and gray header rows, each containing a 4-row by 3-column grid for entering budget items, financial indicators, and numerical data. Animal silhouette icons and nature-themed illustrations on the left side visually reinforce the conservation program theme. This slide template is ready to use for fundraising proposals, annual financial reports, budget allocation presentations, and resource management discussions in nonprofit and environmental organizations.
Usage Points
-
Main Usage
Organize and present financial metrics, budget items, and key performance indicators for animal conservation programs in a clear, structured table format. Suitable for fundraising proposals, annual financial reports, budget allocation planning, and stakeholder communication where transparent financial data visualization is essential.
-
How to Use
Enter category names in the table headers (green and gray rows), then input financial items and corresponding numerical values in the four data rows. Use the left-side icon area and text field to add program description. Customize header colors to match your organization's branding while maintaining the data table structure for easy comparison.
-
Recommended For
NGO finance managers, wildlife conservation project leaders, fundraising officers, budget planning specialists, nonprofit board members, and grant administrators who need to present budget status, resource allocation, and financial transparency to donors, stakeholders, and oversight committees.
-
Slide Structure
Two identical slides featuring left-aligned animal silhouettes (tree and giraffe icons) with descriptive text, and right-aligned dual data tables. Each table has a colored header row (green or gray) with four numbered data rows (01-04) and three columns labeled 'Text or number,' 'Text title,' and 'Text,' optimized for financial data entry and comparative analysis.
Related Products
-

Agricultural Budget Table – Harmony of Green and Purple
#Financial Plans and Performance #Diagram #Budget
-

Table of Major Financial Indicators – Optimized for Performance Analysis
#Financial Plans and Performance #Diagram #Budget
-

Red Purple Highlight Table – An Ideal Choice for Financial Planning
#Financial Plans and Performance #Diagram #Budget
-

Travel Table Text Box – Visualizing Financial Plans and Outcomes
#Financial Plans and Performance #Diagram #Budget
