Required Fund Planning Chart – Visualizing Financial Performance
RJ0800020_15
- Last Update 08/05/2025
- File Size 0.2MB
- # of Slides 2
- File Format PPTX
- Slide Ratio 16:9
- Color
Keywords
About the Product
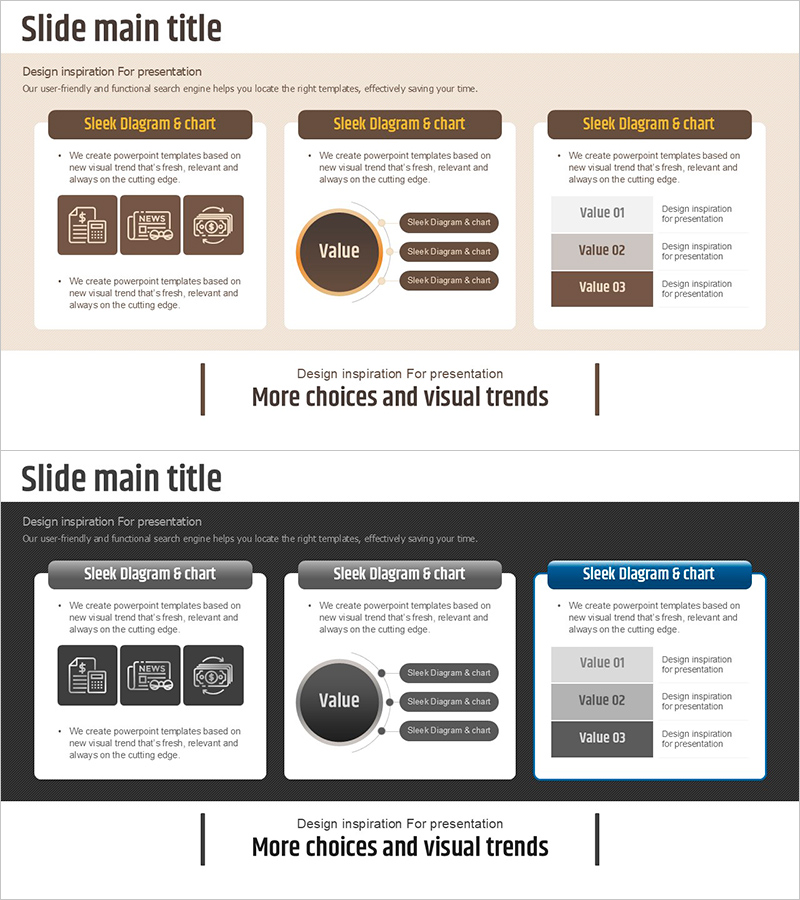
A professional PowerPoint slide for visualizing investment fund allocation and financial performance metrics. This 2-slide presentation features a beige background with brown accent boxes and circular diagrams, combining icon-based information on the left, a central value indicator, and a right-aligned list format for data entry. Ideal for investor presentations, financial reports, and budget allocation discussions, this slide clearly communicates fund requirements and distribution strategies. All text and numerical values are fully editable, and the 16:9 widescreen PPTX format ensures compatibility with modern presentation systems.
Usage Points
-
Main Usage
Consolidate investment fund size, fund allocation by category, and financial performance indicators on a single slide to enhance credibility and transparency. Effectively communicate fund utilization strategy in business plans, investor pitch decks, and financial reports.
-
How to Use
Enter fund requirement categories (equipment, personnel, operations, etc.) in the left icon area, display total amount in the central circular diagram, and list itemized amounts with descriptions on the right. Colors and values are fully customizable, and the number of items can be adjusted to match your presentation needs.
-
Recommended For
Perfect for CFOs and finance managers presenting fund allocation to executives, investors, and boards. Suitable for startup fundraising, corporate expansion budgets, quarterly financial reports, and any presentation requiring fund allocation decision-making.
-
Slide Structure
Two-slide set with beige background on slide 1 and black background on slide 2, both featuring identical layout: 3 icon input areas on left, 1 central circular value indicator, and 3-item right-aligned list. Total of 6 editable text areas per slide (3 icons + 1 value + 3 list items) for flexible data customization.
Related Products
-

Financial Planning and Investment Strategy PPT Circular Diagram
#Financial Plans and Performance #Diagram #Capital Requirements
-

Comparison of Air and Transportation Costs – Easy Economic Choices
#Financial Plans and Performance #Text Box #Capital Requirements
-

Modern Graph Slide Template for Data Visualization
#Financial Plans and Performance #Diagram #Graph
-

Patient Examination Item Table Slide – Efficient Data Management
#Financial Plans and Performance #Diagram #Capital Requirements
