Comparison of Air and Transportation Costs – Easy Economic Choices
RJ0600095_15
- Last Update 07/16/2025
- File Size 0.8MB
- # of Slides 2
- File Format PPTX
- Slide Ratio 16:9
- Color
Keywords
- #Content-Based Slides
- #Design-Based Slides
- #Financial Plans and Performance
- #Text Box
- #Capital Requirements
- #Tax Strategy and Benefits
- #Rounded Rectangle Text Box
- #16:9
- #comparison slide PowerPoint
- #cost comparison presentation
- #3-item comparison slide
- #global network PPT
- #financial comparison template
About the Product
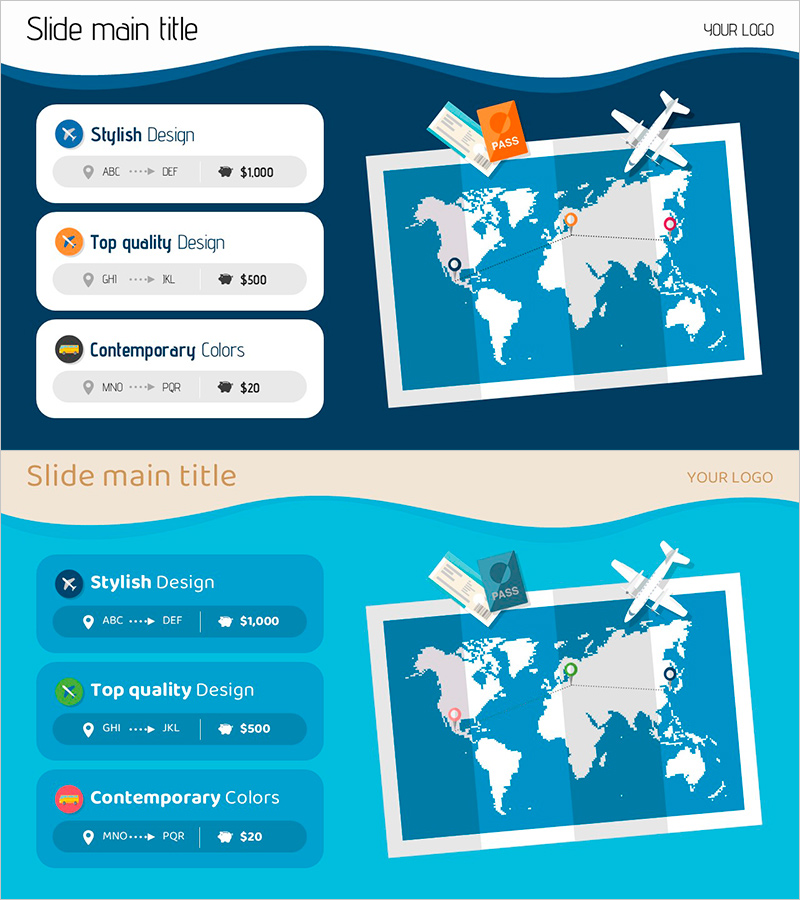
A PowerPoint slide designed for comparing global network costs and transportation expenses. The dark blue background features three white rounded boxes arranged vertically on the left, each with dedicated areas for icons, route information, and pricing data. The right side displays a world map with airplane and aircraft illustrations, emphasizing the global business context. This 2-slide, 16:9 aspect ratio PPTX template is fully editable and ready for immediate use in financial planning presentations, cost analysis reports, and budget optimization discussions.
Usage Points
-
Main Usage
Enables parallel comparison of three cost categories—such as air travel, ground transportation, and alternative options—to support economic decision-making. Each item displays route, price, and key features at a glance, helping stakeholders evaluate international logistics and travel cost optimization.
-
How to Use
Enter comparison item names, route details, and pricing in each rounded box text field. Add representative icons or symbols in the designated icon areas, and mark departure and arrival locations on the world map to reinforce credibility in global business presentations.
-
Recommended For
Ideal for CFOs, finance managers, procurement officers, and project managers presenting cost optimization meetings, budget reviews, and supply chain analysis. Particularly effective for international travel cost evaluation, transportation mode selection analysis, and global vendor cost comparison.
-
Slide Structure
Two-slide layout with dark blue background on slide one featuring three left-aligned rounded boxes (each with one input area) and a world map with aircraft illustration on the right. Slide two provides the same layout with a lighter background tone variation. Each box is independently editable, allowing flexible input of pricing, route, and icon data.
Related Products
-

Required Fund Planning Chart – Visualizing Financial Performance
#Financial Plans and Performance #Capital Requirements #Tax Strategy and Benefits
-

Modern Graph Slide Template for Data Visualization
#Financial Plans and Performance #Diagram #Graph
-

Financial Planning and Investment Strategy PPT Circular Diagram
#Financial Plans and Performance #Diagram #Capital Requirements
-

Table of Contents for Strategic Planning from Takeoff to Arrival – Effective Operational Planning
#Operational Plan #Marketing Plan and Strategy #Diagram
