Traffic Accident Status Chart – Data-Driven Operational Planning
RJ0800023_29
- Last Update 08/06/2025
- File Size 0.7MB
- # of Slides 2
- File Format PPTX
- Slide Ratio 16:9
- Color
Keywords
- #Content-Based Slides
- #Design-Based Slides
- #Operational Plan
- #Financial Plans and Performance
- #Diagram
- #Business Support Plan
- #Capital Requirements
- #Table
- #16:9
- #traffic accident data table PowerPoint
- #comparison analysis slide
- #operational planning data visualization
- #how to create data tables in PowerPoint
- #accident statistics presentation slide
About the Product
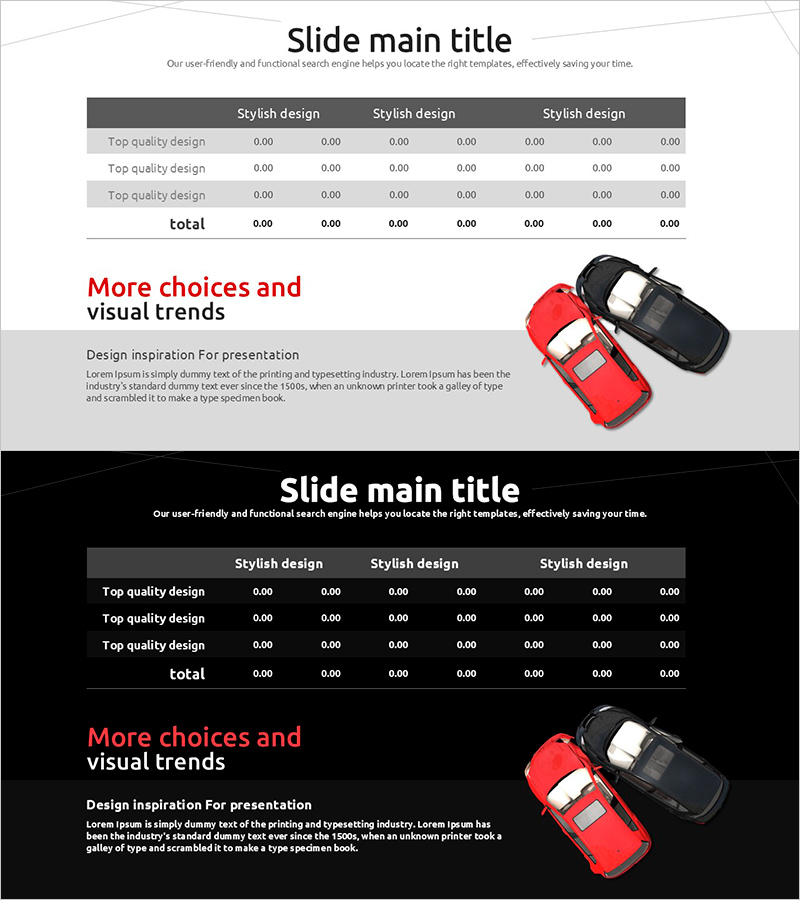
A data-driven PowerPoint slide for analyzing and reporting traffic accident statistics with quantitative metrics. Features a 3-column comparison table layout with dark gray header and light gray data rows, enabling clear visualization of numerical indicators. Includes title area at the top and text description space at the bottom for immediate use in operational reports and planning presentations. Composed of 2 slides in 16:9 widescreen format with fully editable data fields and text, adaptable to various analytical scenarios and reporting requirements.
Usage Points
-
Main Usage
Quantitatively analyze and compare traffic accident-related statistical data for operational decision-making. The clear distinction between dark header and light data rows enhances numerical readability and serves as evidence base for operational planning and risk assessment.
-
How to Use
Enter analysis topic in the title area, input traffic accident statistics, costs, and reduction rates into the 3-column table, and add analytical findings and improvement strategies in the bottom text section. Place within the current situation analysis section of operational planning documents.
-
Recommended For
Traffic safety managers, operations teams, policy makers, and insurance risk management professionals preparing status analysis reports and operational planning presentations. Suitable for any organization requiring quantitative data-based decision-making and performance reporting.
-
Slide Structure
2-slide composition with each slide containing: title area (1 row), central 3-column comparison table (4 rows: header + 3 data rows + total), and bottom text description area (2-3 rows). Light gray background with dark gray header clearly distinguishes information hierarchy.
Related Products
-

Estimated Budget Breakdown – Financial Planning and Budget Management
#Financial Plans and Performance #Diagram #Capital Requirements
-

Funding Plan Table – Efficient Fund Management
#Marketing Plan and Strategy #Financial Plans and Performance #Diagram
-

Yellow Highlight Standard Table – Financial Performance Visualization
#Financial Plans and Performance #Diagram #Capital Requirements
-

Hotpot Table Chart – Clearly Present Financial Performance
#Financial Plans and Performance #Diagram #Capital Requirements
