Financial Planning and Investment Strategy PPT Circular Diagram
RB0800041-1_4
- Last Update 03/25/2025
- File Size 2MB
- # of Slides 2
- File Format PPTX
- Slide Ratio 4:3
- Color
Keywords
- #Content-Based Slides
- #Design-Based Slides
- #Financial Plans and Performance
- #Diagram
- #Capital Requirements
- #Tax Strategy and Benefits
- #Flow
- #Spread
- #Circular Flow
- #Centralized Diagram
- #4:3
- #circular diagram PowerPoint
- #financial investment strategy slide
- #3-node cycle diagram
- #process flow presentation
- #financial planning template
About the Product
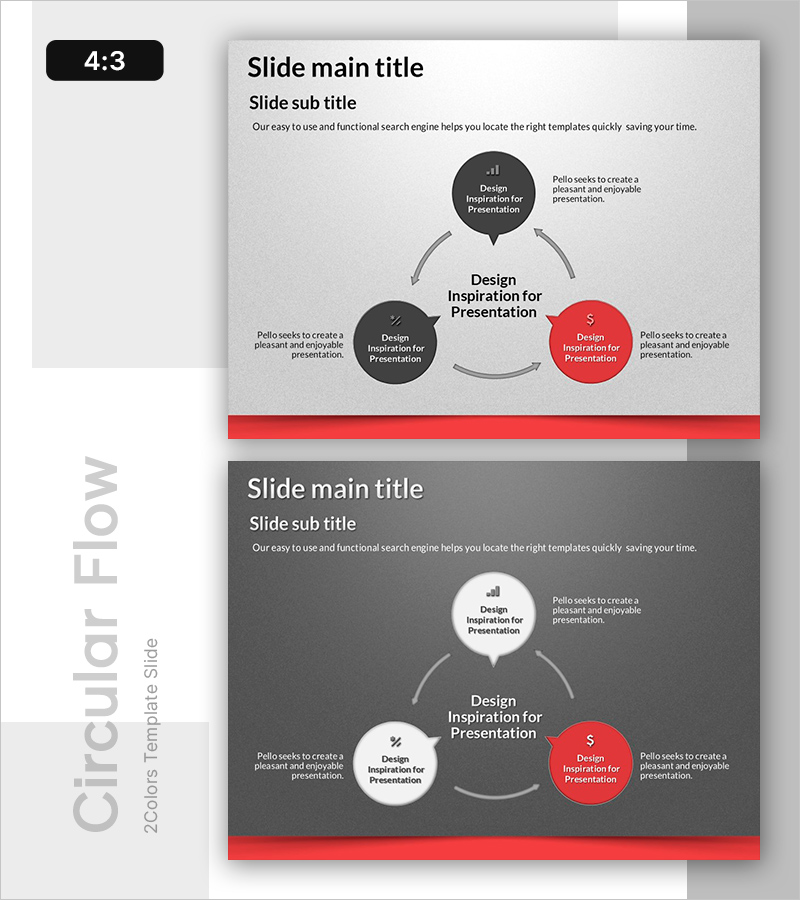
A 3-node circular diagram PowerPoint slide for visualizing financial planning and investment strategy. The diagram features a central concept with three related elements connected by arrows in a cyclical flow, ideal for representing interconnected processes or strategic phases. The color scheme combines dark gray, white, and red nodes to visually distinguish priorities and emphasis points, with editable text areas for each node. Delivered in 4:3 aspect ratio with 2 slides, ready to use for explaining financial strategy, investment planning, capital allocation, and fund distribution in presentations.
Usage Points
-
Main Usage
Illustrates interconnected financial processes such as investment strategy, capital allocation, and fund distribution using a circular structure. The diagram flows from a central concept outward to three related elements and cycles back to the center, emphasizing repetitive and cyclical decision-making frameworks in finance.
-
How to Use
Apply in investment strategy presentations, financial planning reports, and financial product explanations to clarify relationships between core concepts and detailed strategies. Edit node text to input specific strategy names or phase titles, and modify colors to distinguish priorities or categories across your presentation.
-
Recommended For
Financial professionals, investment analysts, treasury managers, finance executives, banking sales representatives, and asset management specialists presenting investment portfolios, fund management strategies, and financial goal achievement roadmaps.
-
Slide Structure
Central dark gray circular node (core concept) with three surrounding nodes—dark gray, white, and red—positioned at top, left, and right. All four nodes connected by bidirectional arrows forming a cyclical flow. Editable text areas positioned to the right of each node. Red accent bar at slide bottom for visual closure.
Related Products
-

Visualizing an Effective Diet Route – Journey Towards a Healthy Lifestyle
#Business Vision and Strategy #Operational Plan #Diagram
-

Energy Business Sector Diagram Slide – Flow and Spread
#Company Introduction #Business Introduction #Diagram
-

Strategies to Overcome Business Challenges – Utilizing a Radial Diagram
#Company Introduction #Marketing Plan and Strategy #Diagram
-

Communication Business Area Diagram
#Company Introduction #Business Introduction #Diagram
