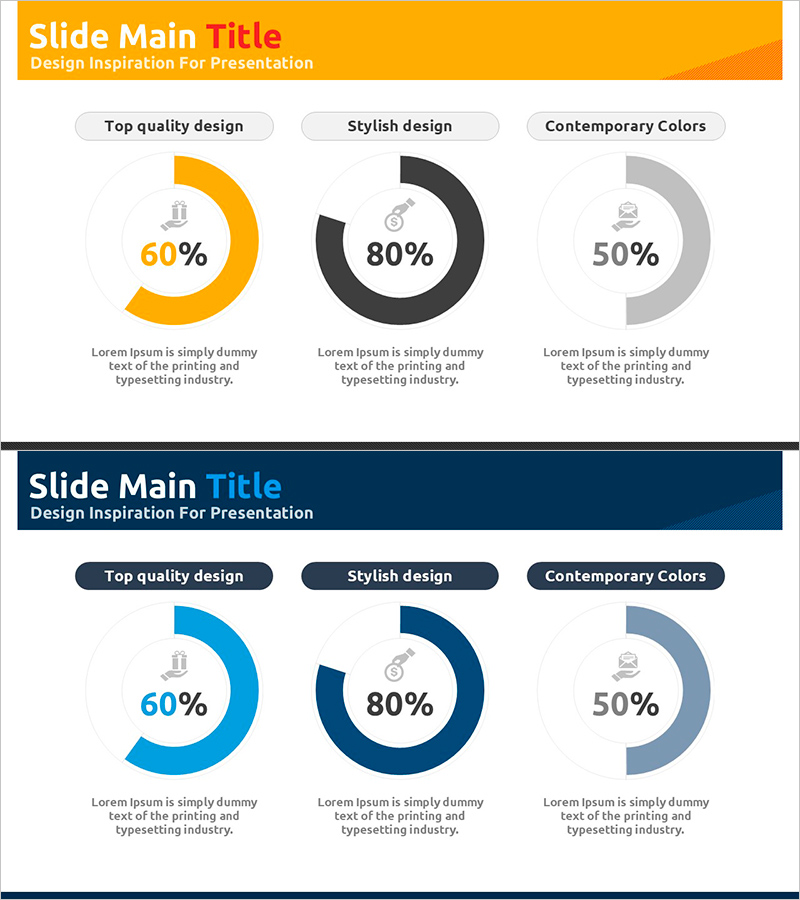
Donations Type and Status Visualized in Doughnut Chart
RJ0800016_5
- Last Update 08/04/2025
- File Size 0.3MB
- # of Slides 2
- File Format PPTX
- Slide Ratio 16:9
- Color
Keywords
- #Content-Based Slides
- #Design-Based Slides
- #Product/Service Introduction
- #Market and Competitor Analysis
- #Graph
- #Development Status
- #Market Share
- #Circles
- #Doughnut Chart
- #16:9
- #doughnut chart PowerPoint
- #pie chart slide template
- #donation analysis presentation
- #3-segment donut chart
- #proportional data visualization PPT
- #circular graph slide
About the Product
A PowerPoint slide featuring a three-segment doughnut chart that visualizes donation types and distribution status. The circular graph uses orange, black, and gray color schemes to represent proportional data intuitively, with clear labels at the top and descriptive text at the bottom for context. The 2-slide set offers multiple color combinations to match your presentation tone, formatted in 16:9 widescreen for compatibility with modern projectors and online meetings. Ideal for donation reports, fundraising presentations, financial status updates, and any scenario requiring proportional data visualization with immediate usability.
Usage Points
-
Main Usage
Visualizes proportional data such as donation type distribution, fund allocation status, and revenue composition across three segments using a doughnut chart format. The hollow center allows placement of key metrics or titles, enhancing information delivery efficiency.
-
How to Use
Use in donation reports, fundraising presentations, nonprofit annual reports, and corporate social responsibility announcements to explain donation amounts, types, and distribution. Easily edit segment values and labels to match your actual data and customize for specific organizational needs.
-
Recommended For
Nonprofit staff, fundraising managers, CSR marketing professionals, financial analysts, donation management departments, and social contribution program coordinators seeking to communicate donation status clearly and professionally.
-
Slide Structure
Two-slide set presenting identical 3-segment doughnut charts in orange and black-gray color schemes. Each slide includes a title area at the top, centered doughnut chart with three segments, and descriptive text area at the bottom, optimized for 16:9 aspect ratio across all display sizes.
Related Products
-

VR System Development Status Analysis Graph – Visualization of Market Share
#Product/Service Introduction #Market and Competitor Analysis #Graph
-

Holiday vs Break Time Analysis Doughnut Chart
#Product/Service Introduction #Market and Competitor Analysis #Graph
-

Doughnut Chart for Online Shopping Mall Market Analysis
#Product/Service Introduction #Market and Competitor Analysis #Graph
-

Graph of Transportation Service Usage Status – Market and Competitor Analysis
#Product/Service Introduction #Market and Competitor Analysis #Graph
