Yellow Blue Line Chart – Market Status and Revenue Analysis
RJ0800016_24
- Last Update 08/04/2025
- File Size 0.3MB
- # of Slides 2
- File Format PPTX
- Slide Ratio 16:9
- Color
Keywords
About the Product
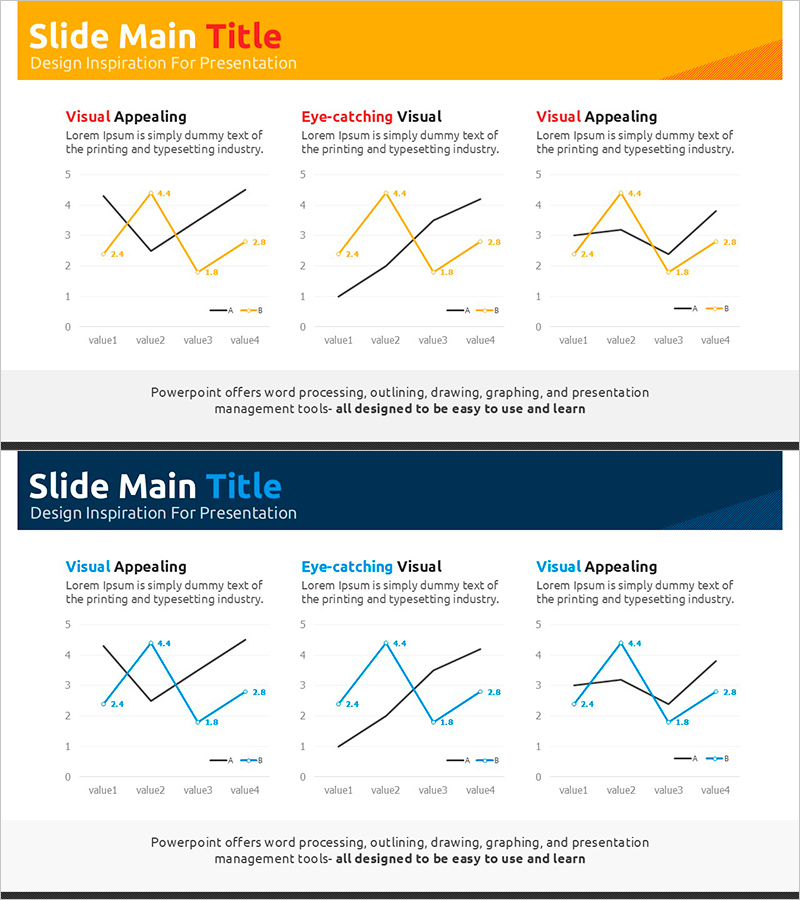
A PowerPoint slide featuring dual-series line charts in yellow and blue for market status and revenue analysis. This presentation slide visualizes comparative data across two data series, with text areas positioned above each chart to present analysis findings. Optimized for 16:9 widescreen format in a 2-slide set, it effectively displays financial metrics such as sales trends, revenue performance, and market share. Clear value labels and legends on the charts enhance audience comprehension during presentations. Provided in fully editable PPTX format for immediate customization.
Usage Points
-
Main Usage
Visualizes time-series data such as market trends, sales performance, and revenue changes across two or more data series. The contrast between yellow and blue lines enables comparison of competitor performance, actual vs. forecast results, or multiple product line outcomes simultaneously.
-
How to Use
Use in investor presentations, executive briefings, and business plan discussions to communicate financial performance and market insights data-driven. Add analysis conclusions or key insights in the text areas above charts to support numerical interpretation. Customize chart legends and axis labels to match your specific data requirements.
-
Recommended For
Ideal for finance teams, business development units, and marketing departments presenting quarterly or annual performance reports. Particularly effective in IR materials, business plans, and marketing strategy documents when analyzing market share evolution and revenue sustainability.
-
Slide Structure
Each slide features a title area at the top, one line chart in the center, and three text boxes positioned above the chart. The chart displays four data points (value1–value4) with yellow and blue lines intersecting at key comparison points. Both slides maintain consistent layout for cohesive presentation flow.
Related Products
-

Column Chart for PowerPoint – Visualization of Market Analysis and Performance
#Market and Competitor Analysis #Financial Plans and Performance #Graph
-

Trends in Visits to Traditional Villages – Data Visualization of Market Status
#Market and Competitor Analysis #Financial Plans and Performance #Graph
-

Highlighted Curved Graph for Market Analysis
#Market and Competitor Analysis #Financial Plans and Performance #Graph
-

Purple Green Flower Market Analysis – Market Status and Competitive Analysis
#Market and Competitor Analysis #Financial Plans and Performance #Graph
