Share Chart by Region – Market Analysis Tool
RJ0800015_25
- Last Update 08/04/2025
- File Size 0.9MB
- # of Slides 2
- File Format PPTX
- Slide Ratio 16:9
- Color
Keywords
About the Product
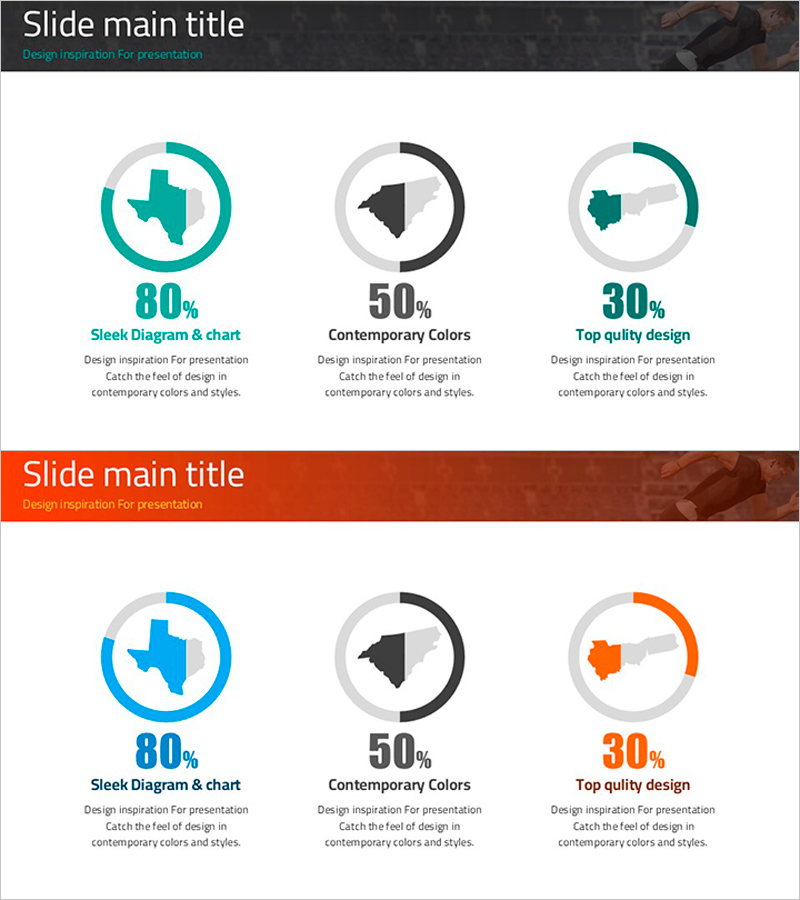
A three-segment donut chart PowerPoint slide designed to visualize regional market share distribution. The circular graph features teal, black, and charcoal color schemes that clearly represent each region's percentage share. With 2 slides included, this template is ready for immediate use in market analysis presentations, business reports, and strategic planning decks. The design incorporates percentage labels and data points to maximize information clarity and audience engagement in professional business presentations.
Usage Points
-
Main Usage
Visualizes regional distribution, market share percentages, revenue breakdown, and customer segment distribution using a donut chart format. The hollow center allows for additional text, icons, or key metrics to be inserted, increasing information density.
-
How to Use
Ideal for market analysis sections in marketing reports, competitive landscape slides in business plans, and quarterly performance presentations. Simply edit the percentage values and labels with your actual data to create a professional presentation-ready slide.
-
Recommended For
Marketing managers, sales directors, and executives preparing data-driven presentations. Perfect for market share comparisons, regional revenue analysis, customer demographic distribution, and any business scenario requiring ratio-based data visualization.
-
Slide Structure
2-slide template featuring the first slide with teal, black, and charcoal donut chart, and the second slide with an alternative color combination (blue, black, charcoal). Each slide contains three segments displaying 80%, 50%, and 30% proportions with corresponding labels and percentage text.
Related Products
-

Target Market Map for the US Space Industry – Market Analysis Slide
#Market and Competitor Analysis #Graph #Other
-

Target Country Market Share Analysis Graph
#Market and Competitor Analysis #Graph #Other
-

Donut Chart in Overseas Markets – Market Share Analysis
#Market and Competitor Analysis #Graph #Other
-

Analysis of Target Market Construction Status – Data Visualization Tool
#Market and Competitor Analysis #Graph #Other
