Stack Bar Chart Map for Market and Competitor Analysis
RJ0800015_24
- Last Update 08/04/2025
- File Size 1.3MB
- # of Slides 2
- File Format PPTX
- Slide Ratio 16:9
- Color
Keywords
- #Content-Based Slides
- #Design-Based Slides
- #Market and Competitor Analysis
- #Marketing Plan and Strategy
- #Graph
- #Other
- #Market Analysis
- #Marketing Objectives
- #Column
- #Segmented Column
- #16:9
- #stacked bar chart PowerPoint
- #market analysis slide template
- #competitor analysis chart
- #Europe map slide
- #regional data comparison
About the Product
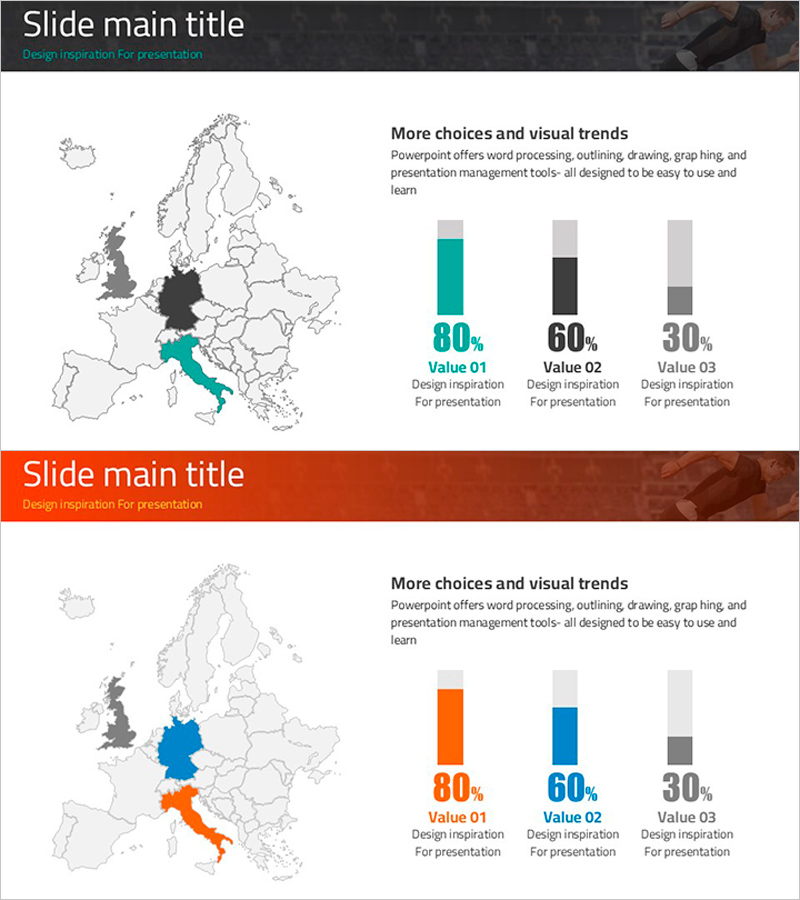
A PowerPoint slide combining a detailed Europe map with three-series vertical stacked bar charts for comprehensive market and competitor analysis. Each country is color-coded on the map, with corresponding stacked bar data displayed on the right side for simultaneous regional comparison. The slide structure enables clear visualization of total market size, individual competitor shares, and regional performance metrics. Fully editable text fields and 16:9 widescreen format (2 slides) allow immediate integration into presentations and business reports.
Usage Points
-
Main Usage
Visualize regional market size, competitor market share, and sales performance across European countries in a single integrated view. The stacked bar structure simultaneously displays total volume and individual series breakdown, making it ideal for complex multi-dimensional data presentation.
-
How to Use
Input market data corresponding to highlighted countries (Italy, Germany, UK, etc.) into the stacked bar chart fields. Maintain the color-coding system while updating numerical values, or customize country selection to match your specific analysis scope. All text labels and data fields are fully editable.
-
Recommended For
Marketing strategy presentations, business performance reports, investor pitch decks, executive briefings, and market research presentations. Particularly effective for European market entry strategies, global sales performance reviews, and regional competitive landscape analysis.
-
Slide Structure
Slide 1: Europe map with country-level color differentiation + right-aligned three-series vertical stacked bar chart (Value 01–03). Slide 2: Identical layout for multi-period or scenario comparison. Each bar segment uses distinct color gradients for series differentiation with clear text label zones.
Related Products
-

Case Study Slides Using Diagrams and Charts
#Market and Competitor Analysis #Marketing Plan and Strategy #Diagram
-

Business Achievement Goals Diagram – Market Analysis and Marketing Strategy
#Market and Competitor Analysis #Marketing Plan and Strategy #Graph
-

Business Plan Template with Area Chart for Market Analysis
#Market and Competitor Analysis #Marketing Plan and Strategy #Graph
-

Orange Hexagon Presentation Template Segmented Vertical Bar Graph – Market and Competitive Analysis
#Market and Competitor Analysis #Graph #Other
