Trend of Market Share by Suit Product – Effective Graph for Market Analysis
RJ0800014_12
- Last Update 08/03/2025
- File Size 5.5MB
- # of Slides 2
- File Format PPTX
- Slide Ratio 16:9
- Color
Keywords
About the Product
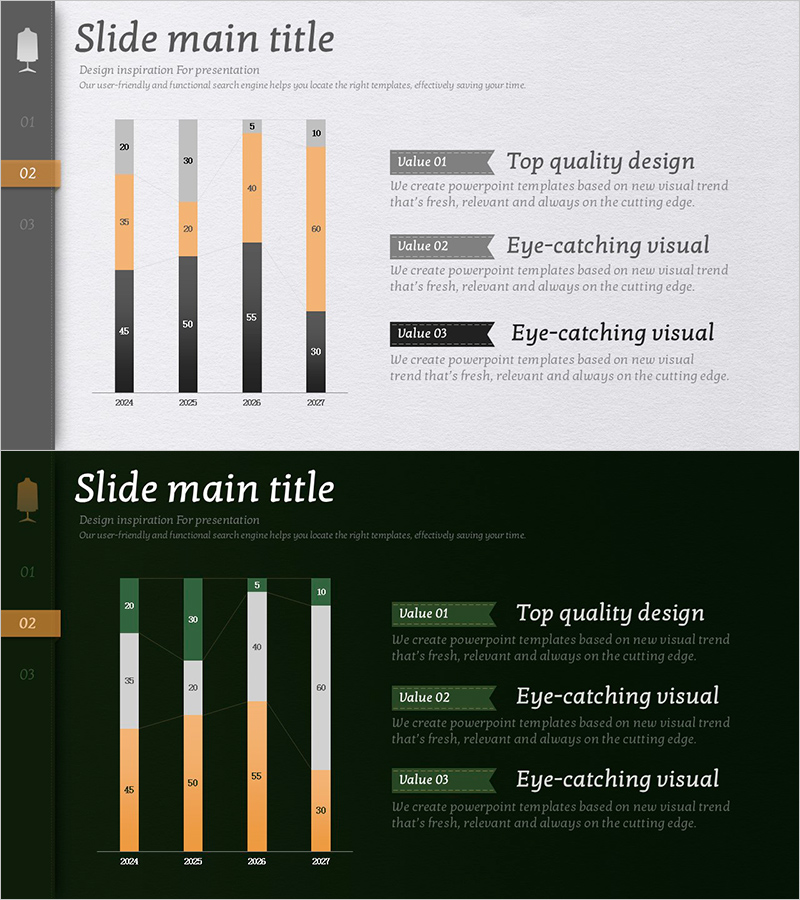
A vertical bar chart PowerPoint slide optimized for market analysis and product performance comparison. This presentation template visualizes data across four years (2024–2027) using three data series (black, orange, gray) to show market share fluctuations over time. Cumulative value labels on each bar make it easy to understand overall scale, while three value callout boxes on the right emphasize key insights during presentations. Two design variations—light and dark backgrounds—are included to match your presentation theme.
Usage Points
-
Main Usage
Clearly compare year-over-year and product-by-product market share, revenue, or sales volume trends. Cumulative value indicators allow simultaneous viewing of total scale and individual series growth rates, making data interpretation straightforward.
-
How to Use
Use in market analysis presentations, business performance reports, and product strategy briefings to visualize comparative data across multiple years. Insert key insights (highest growth rate, market leader, major shifts) into the value callout boxes to direct audience attention.
-
Recommended For
Marketing managers, sales directors, business planners, financial analysts, and consultants who rely on data-driven decision-making. Ideal for quarterly and annual performance reports, executive briefings, and strategic planning sessions.
-
Slide Structure
2-slide set. Each slide features a vertical bar chart on the left (4 years × 3 data series) with cumulative values displayed, and three labeled value callout boxes (Value 01, 02, 03) on the right. Light background variant (gray, orange, black) and dark background variant (black, orange, white) both included.
Related Products
-

3D Segmented Bar Graph for Performance Analysis – Market Trends
#Market and Competitor Analysis #Graph #Customer Analysis
-

Visualizing Four-Year Change in Sales – An Effective Tool for Market Analysis
#Market and Competitor Analysis #Graph #Market Analysis
-

Stereographic Segmentation Bar Chart – Visualization of Market Analysis and Trends
#Market and Competitor Analysis #Graph #Market Analysis
-

Market Trends and Analysis Green Navy – Clearly Displaying Market Trends
#Market and Competitor Analysis #Graph #Market Analysis
