Sales Status by Food Truck Product – Market Share Analysis
RJ0800013_7
- Last Update 08/03/2025
- File Size 0.4MB
- # of Slides 2
- File Format PPTX
- Slide Ratio 16:9
- Color
Keywords
- #Content-Based Slides
- #Design-Based Slides
- #Market and Competitor Analysis
- #Graph
- #Market Status
- #Market Share
- #Circles
- #Doughnut Chart
- #16:9
- #donut chart PowerPoint slide
- #pie chart presentation template
- #market share analysis PPT
- #sales data visualization
- #circular graph slide
- #business chart template
About the Product
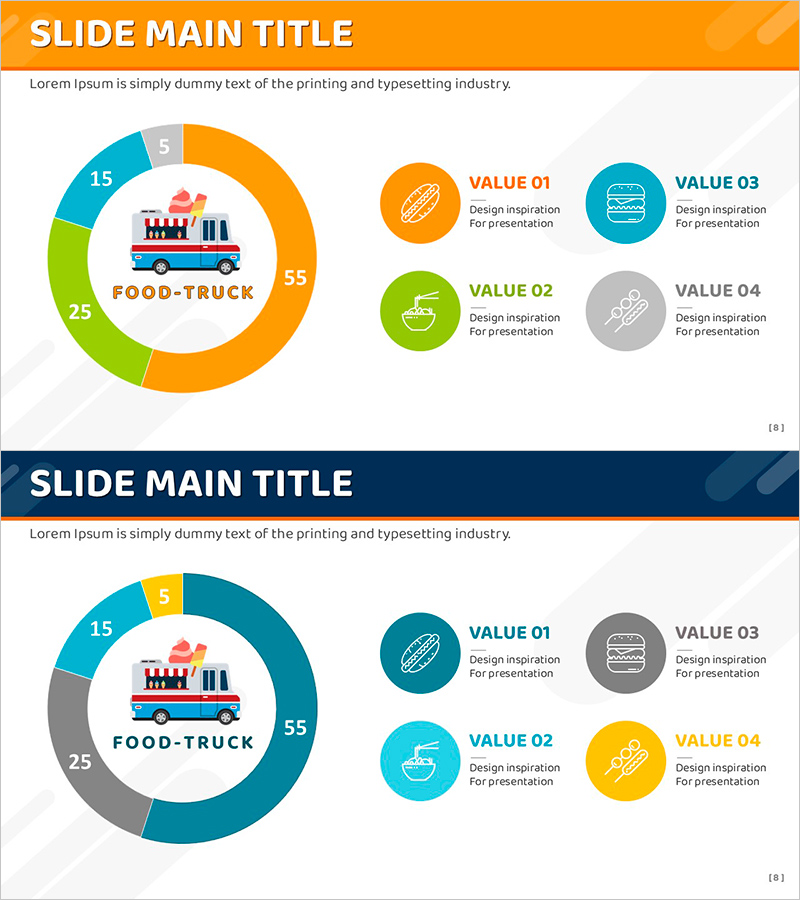
A donut chart PowerPoint slide that visualizes food truck product sales status and market share distribution. Four color-coded segments (orange, teal, green, gray) represent proportional data (55%, 25%, 15%, 5%) with a central food truck icon for visual context. Four circular callout boxes on the right (VALUE 01–04) provide space for detailed explanations of each segment. This slide design is ideal for business presentations, marketing plans, sales reports, and data-driven decision-making. The 2-slide set offers multiple color variations and is fully editable in PPTX format for immediate customization.
Usage Points
-
Main Usage
Visualize product-by-product or segment-by-segment sales ratios using a donut chart format to communicate market share at a glance. The central icon and four explanation areas on the right enable simultaneous presentation of segment meaning and strategic implications in a data-driven slide.
-
How to Use
Apply to market analysis sections in business reports, competitive landscape slides in marketing plans, revenue composition in investor presentations, or product performance reviews. Edit segment values and labels to match your data, and populate the VALUE fields with product characteristics, strategies, or performance metrics.
-
Recommended For
Marketing managers, business planners, financial analysts, and executives presenting market conditions, revenue composition, or customer distribution. Applicable across retail, food service, distribution, manufacturing, and other industries for product-by-product, regional, or channel-based ratio analysis.
-
Slide Structure
Donut chart with 4 segments (55%, 25%, 15%, 5%) and central icon, paired with 4 circular callout boxes (VALUE 01–04) on the right. 2-slide set with two color schemes: orange/teal/green/gray and orange/teal/yellow/gray. 16:9 widescreen format, fully editable PPTX.
Related Products
-

Donut Chart for Components and Market Share Visualization – Market Analysis
#Market and Competitor Analysis #Graph #Market Status
-

How to Protect Your Environment Pie Chart
#Market and Competitor Analysis #Graph #Market Status
-

Distribution Graph of Food Materials – Market Status Chart
#Market and Competitor Analysis #Graph #Other
-

Visualizing Value Ratios with Pie Charts – Essential Presentation Template
#Market and Competitor Analysis #Diagram #Graph
