Visualizing Market Share with Detailed Item Analysis Chart
RB0800019_9
- Last Update 03/21/2025
- File Size 2.6MB
- # of Slides 2
- File Format PPTX
- Slide Ratio 4:3
- Color
Keywords
- #Content-Based Slides
- #Design-Based Slides
- #Market and Competitor Analysis
- #Diagram
- #Graph
- #Market Status
- #Market Share
- #Spread
- #Circles
- #Doughnut Chart
- #4:3
- #donut chart PowerPoint slide
- #pie chart template
- #market share visualization
- #ratio analysis presentation
- #donut graph PPT download
- #how to create donut chart in PowerPoint
About the Product
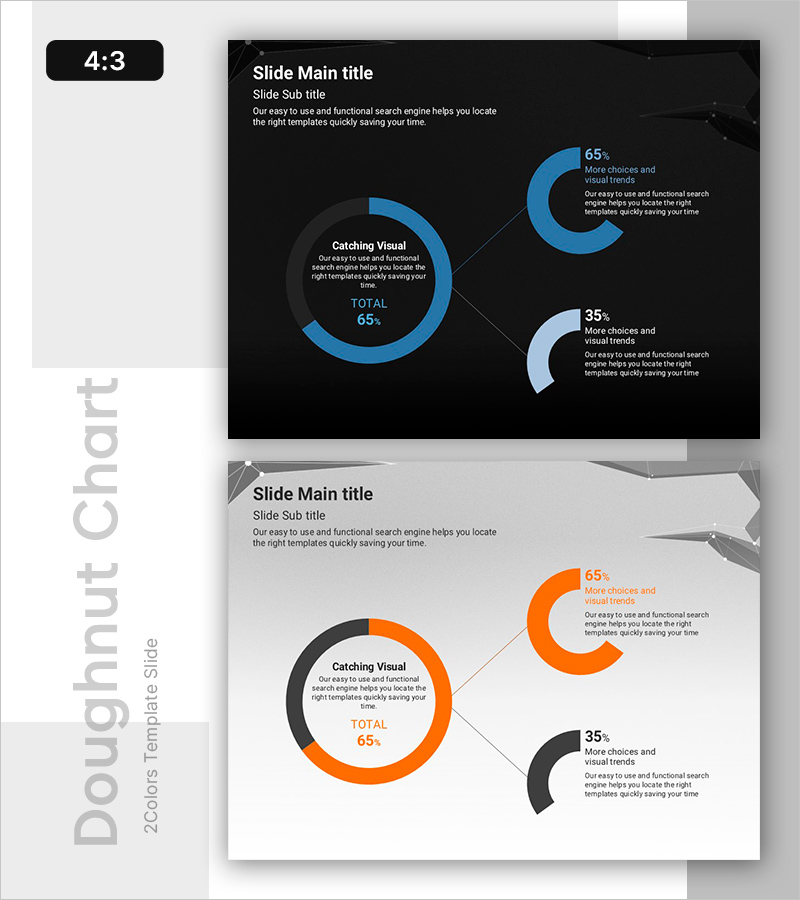
A donut chart PowerPoint slide that displays both central aggregate values and peripheral segment details simultaneously. Designed with a dark background and blue-orange dual-tone color scheme, it connects the central total percentage with individual segment percentages using directional lines to clearly visualize hierarchical data relationships. This presentation template is ready to use for market share analysis, sales composition breakdown, customer distribution reports, and ratio-based analytical materials.
Usage Points
-
Main Usage
A donut chart designed to display the proportional relationship between total scale and individual segments at a glance. It simultaneously presents the central total value (TOTAL 65%) and peripheral segment percentages (65%, 35%, etc.) to effectively communicate hierarchical data structures.
-
How to Use
Use this slide for market share analysis, sales composition ratios, customer segment distribution, budget allocation status, and other ratio-based data presentations. Simply replace the central text and peripheral values with your actual data for immediate use.
-
Recommended For
Ideal for marketing plans, business reports, investor presentations, and quarterly performance analysis briefings. Suitable for executive reports, client presentations, and internal meetings, particularly valuable for data analysis sections in finance, retail, and manufacturing industries.
-
Slide Structure
2-slide set. Slide 1: Dark background with central donut chart (total 65%) connected to 3 peripheral segments (65%, 35%, etc.). Slide 2: Orange-tone background version with identical structure. 4:3 aspect ratio, PPTX format with all elements fully editable.
Related Products
-

Guide to Admission Evaluation Criteria with Donut Chart
#Market and Competitor Analysis #Graph #Market Status
-

Enrollment Stats & Ratios Donut Chart
#Market and Competitor Analysis #Graph #Market Status
-

Leaf Illustration Donut Chart - Visualizing Market Share
#Market and Competitor Analysis #Graph #Market Status
-

Food Nutrient Diagram – Market Share and Status Analysis
#Market and Competitor Analysis #Graph #Market Status
