Graph of Price Changes Due to Inflation – Essential Template for Economic Analysis
RJ0800013_15
- Last Update 08/03/2025
- File Size 2.4MB
- # of Slides 2
- File Format PPTX
- Slide Ratio 16:9
- Color
Keywords
About the Product
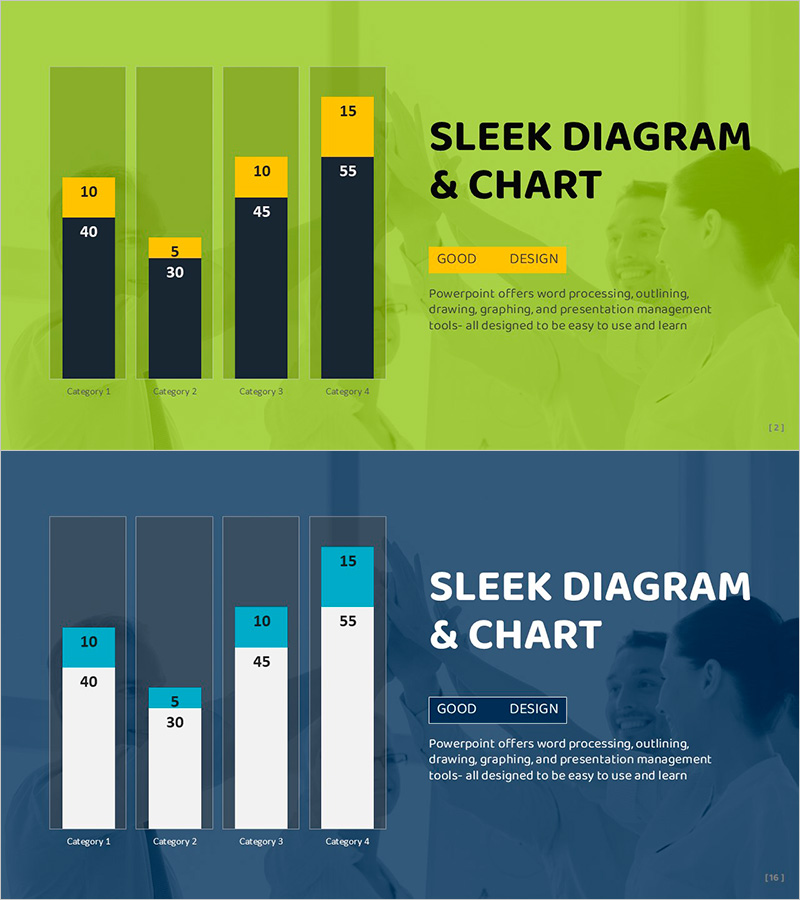
A stacked bar chart PowerPoint slide optimized for economic analysis and financial reporting presentations. The design features a lime green and dark navy two-tone background with yellow and black data bars that clearly represent category-by-category numerical comparisons. The 2-slide set provides the same chart in both light and dark color schemes, allowing you to select the version that best matches your presentation environment and document style. Instantly applicable for conveying quantitative data such as inflation rates, price changes, and economic indicators in professional presentations.
Usage Points
-
Main Usage
Used to visualize quantitative data by category in economic analysis, financial reports, and sales performance comparisons. The stacked structure simultaneously displays total magnitude and compositional ratios, making it effective for explaining complex indicators such as inflation rates, cost structures, and revenue analysis.
-
How to Use
Open the slide and replace the data values (10, 40, 5, 30, 10, 45, 15, 55) with your actual figures, then change the category labels (Category 1–4) to match your report items. Select the color version that best complements your presentation background and use it directly.
-
Recommended For
Economists, financial analysts, marketing managers, executives preparing board reports, and academic presenters who need to compare quantitative data. Ideal for explaining quarterly performance, regional sales, cost-item breakdowns, and other multi-layered data structures.
-
Slide Structure
Each slide consists of 4 stacked bars representing 4 categories. Each bar is divided into 2–3 data segments (yellow and black) with numerical labels displayed above each segment. The first slide features a lime green background; the second uses a dark navy background for alternative styling.
Related Products
-

Comparison Stacked Graph by Year – Market Trends Analysis
#Market and Competitor Analysis #Graph #Industry Trends
-

Year-over-year Comparison Analysis Bar Graph – Market Trends and Insights
#Market and Competitor Analysis #Graph #Market Analysis
-

Blue Green Basic Line Chart – Market Status and Competitive Analysis
#Market and Competitor Analysis #Graph #Market Status
-

Development Status Analysis Radial Graph – A Tool for Competitive Edge and Growth
#Product/Service Introduction #Market and Competitor Analysis #Graph
