Life Satisfaction After Retirement – Customer Analysis and Market Survey
RJ0800012_21
- Last Update 08/03/2025
- File Size 7.3MB
- # of Slides 2
- File Format PPTX
- Slide Ratio 16:9
- Color
Keywords
About the Product
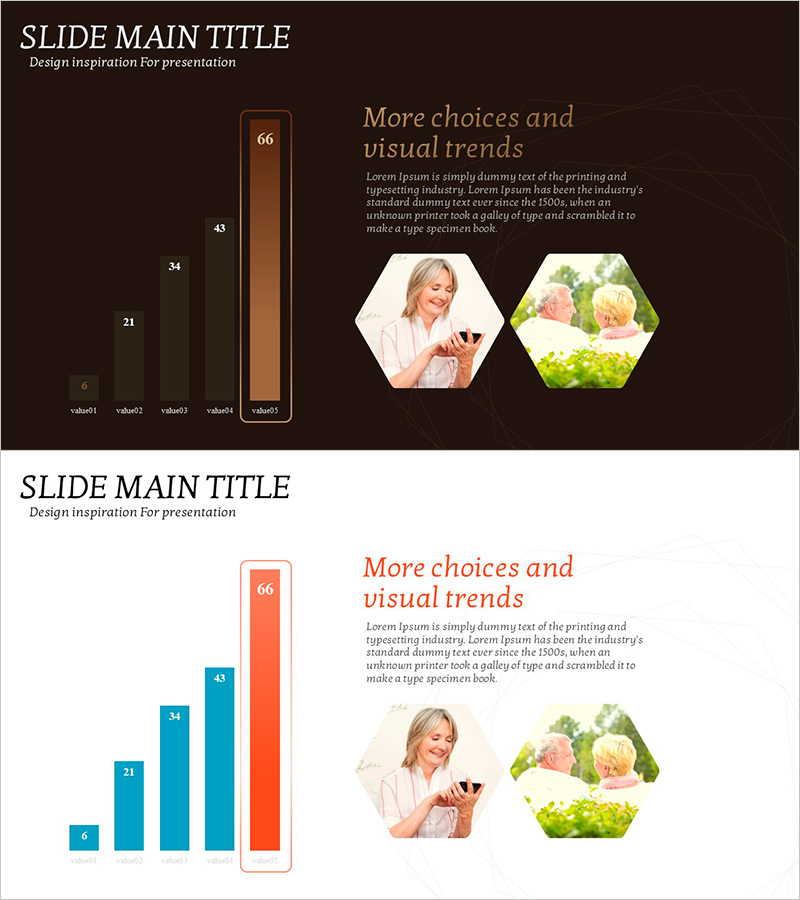
A PowerPoint slide featuring a 5-step horizontal bar chart visualizing life satisfaction after retirement with customer analysis and market survey data. The design combines a dark brown background with gold typography and brown-toned bars, creating a sophisticated presentation aesthetic. Each data point is clearly labeled with numerical values for easy comparison across categories. Provided as a 2-slide PPTX set in 16:9 widescreen format, fully editable and ready to customize. Perfect for presenting customer satisfaction metrics, market share comparisons, competitive analysis, and quantitative research findings in business reports and proposals.
Usage Points
-
Main Usage
Designed to compare and analyze five data categories side-by-side using horizontal bar lengths for intuitive visual comparison. Ideal for presenting customer satisfaction scores, market share percentages, competitive benchmarks, sales performance, and survey results in executive reports and business proposals.
-
How to Use
Open the slide and replace the item labels (value1 through value5) and numerical values with your own data. Bar colors and background tones can be adjusted to match your corporate branding. Font styles, sizes, and text formatting are fully customizable while maintaining the sophisticated dark brown aesthetic.
-
Recommended For
Recommended for executives, marketing professionals, sales teams, management consultants, and research analysts preparing executive summaries, marketing plans, customer analysis reports, market research presentations, and business performance reviews requiring quantitative data visualization.
-
Slide Structure
Slide 1: Dark brown background with 5-item horizontal bar chart (value1=6, value2=21, value3=34, value4=43, value5=66) and gold-colored title text. Slide 2: Light background with the same 5-step bar chart in blue and orange tones, complemented by two hexagon-framed images on the right and descriptive text below.
Related Products
-

Consumer Insights & Behavioral Patterns Analysis Slide
#Market and Competitor Analysis #Graph #Market Status
-

Customer Type Analysis Bar Graph – Data Visualization for Customer Success
#Company Introduction #Market and Competitor Analysis #Customer Success Stories
-

Column Chart Visualization – Customer Analysis and Market Research
#Market and Competitor Analysis #Graph #Text Box
-

Customer Analysis Forecast Graph – Market Trend Analysis
#Market and Competitor Analysis #Graph #Customer Analysis
