Column Chart Visualization – Customer Analysis and Market Research
RJ0600026_9
- Last Update 06/27/2025
- File Size 12.1MB
- # of Slides 2
- File Format PPTX
- Slide Ratio 16:9
- Color
Keywords
- #Content-Based Slides
- #Design-Based Slides
- #Market and Competitor Analysis
- #Graph
- #Text Box
- #Customer Analysis
- #Column
- #Column Chart
- #Speech Bubble
- #16:9
- #vertical column chart PowerPoint
- #bar chart slide template
- #data comparison presentation
- #customer analysis chart
- #market research graph PowerPoint
About the Product
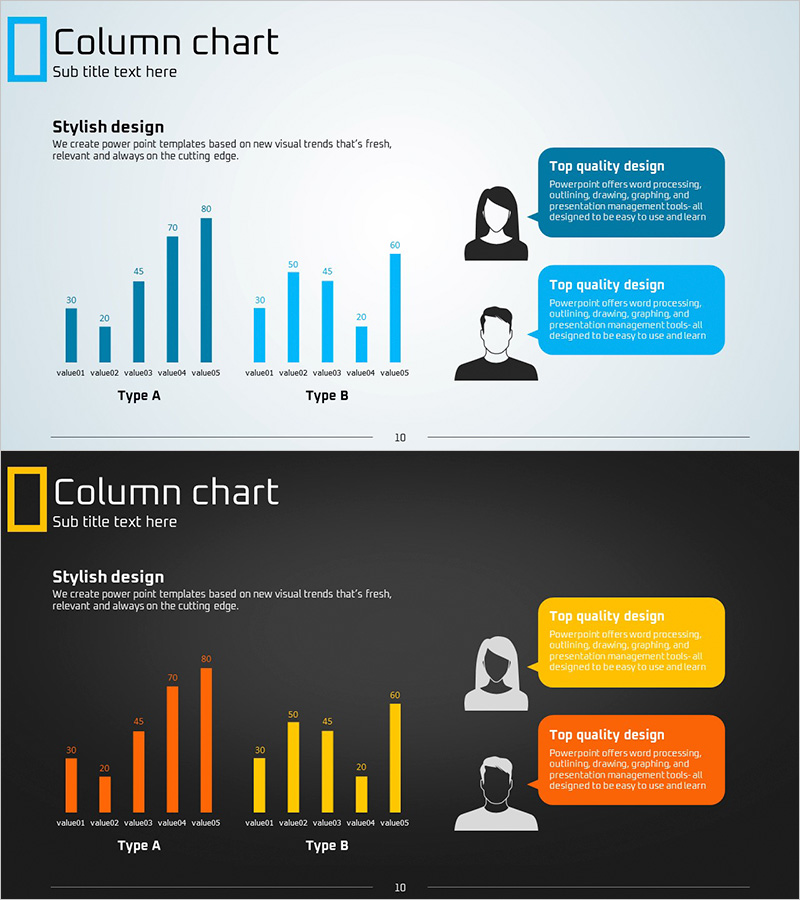
A professional vertical column chart PowerPoint slide designed for customer analysis and market research presentations. The slide features two color series—light blue and dark blue—enabling side-by-side comparison of 10 data points across Type A and Type B categories. Each bar displays numeric labels for clear data interpretation during presentations. The right side includes male and female silhouette icons paired with two teal callout boxes for highlighting key insights and conclusions. The 2-slide set provides both light and dark background versions, allowing you to adapt to different presentation environments and lighting conditions.
Usage Points
-
Main Usage
Visualize quantitative data split into two comparable groups or time periods. Ideal for displaying customer segment performance, regional sales figures, competitive benchmarking, hourly traffic metrics, or any categorical data requiring side-by-side analysis. The callout boxes allow you to emphasize key findings and actionable insights derived from the data.
-
How to Use
Replace the sample values with your actual data by clicking each bar label. Add analysis conclusions or recommendations in the teal callout boxes on the right. Use the light background slide for bright meeting rooms and online presentations; switch to the dark background slide for low-light environments or video recording. Colors and icons can be customized to match your corporate branding.
-
Recommended For
Marketing managers presenting customer segmentation analysis, sales directors reporting regional performance, executives conducting competitive analysis, management consultants delivering benchmarking studies, and data analysts visualizing statistical findings. Suitable for any business presentation requiring quantitative evidence and comparative data visualization.
-
Slide Structure
Slide 1 (light background): Title area + dual-series vertical column chart (Type A: 5 items in light blue + Type B: 5 items in dark blue) + silhouette icons + two teal callout boxes. Slide 2 (dark background): Identical layout with dark gray background and contrasting orange and yellow bar colors. All numeric labels and legend elements are clearly visible and editable.
Related Products
-

Participant Feedback Review Slide – Capturing Customer Voices
#Market and Competitor Analysis #Customer Success Stories #Diagram
-

Visualizing Causes of Workplace Stress with Horizontal Bar Graph
#Market and Competitor Analysis #Graph #Customer Analysis
-

Customer Type Analysis Bar Graph – Data Visualization for Customer Success
#Company Introduction #Market and Competitor Analysis #Customer Success Stories
-

Key Reasons to Learn Financial Management – Wisdom for Future Financial Control
#Market and Competitor Analysis #Text Box #Customer Analysis
