Customer Analysis People Icon Graph – Insights and Data Visualization
RJ0400015_8
- Last Update 05/21/2025
- File Size 0.6MB
- # of Slides 2
- File Format PPTX
- Slide Ratio 16:9
- Color
Keywords
- #Content-Based Slides
- #Design-Based Slides
- #Market and Competitor Analysis
- #Graph
- #Customer Analysis
- #Column
- #Other
- #Column Chart
- #Other Charts
- #16:9
- #infographic PowerPoint slide
- #people icon graph
- #customer analysis presentation
- #data visualization slide
- #percentage chart PPT
- #human silhouette template
About the Product
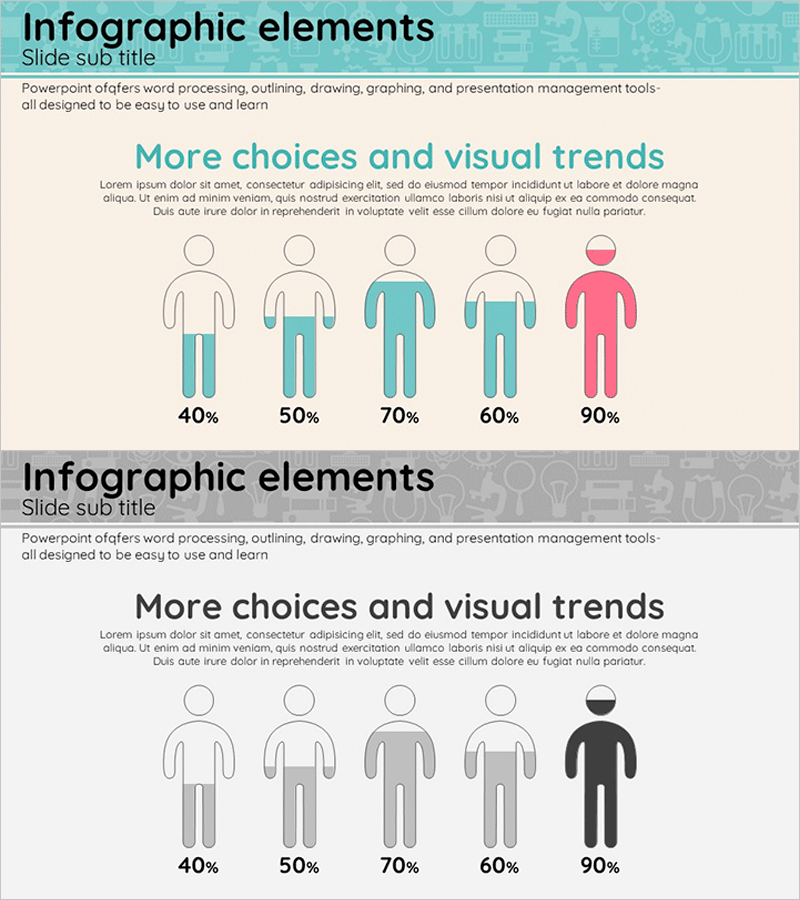
An infographic slide optimized for customer analysis and market research presentations. This PowerPoint template uses silhouette icons with color gradients to visualize five-step percentage data (40%, 50%, 70%, 60%, 90%) in an intuitive format. The turquoise background combined with pink accent colors creates strong visual contrast that highlights key metrics. The slide deck contains 2 slides with clearly separated title and data visualization areas, making it easy to customize text. Perfect for customer segmentation, market share analysis, satisfaction surveys, demographic studies, and competitive positioning presentations.
Usage Points
-
Main Usage
Transform percentage-based data into visual insights using human silhouette icons. Perfect for customer segmentation, market penetration rates, satisfaction metrics, and demographic breakdowns. The turquoise-to-pink color gradient emphasizes key figures while making quantitative information accessible to audiences.
-
How to Use
Enter your analysis topic in the title area (e.g., Customer Satisfaction, Market Penetration Rate). Replace the percentage values with your actual data. Adjust the color fill ratio of each icon to represent additional data series. Add text boxes for legends or supplementary explanations as needed.
-
Recommended For
Marketing managers, market analysts, sales strategists, business intelligence professionals, and executives. Ideal for B2B proposals, quarterly performance reports, customer segmentation strategy presentations, market research findings, and competitive analysis briefings.
-
Slide Structure
2-slide deck with clear separation between title area (turquoise header) and infographic section. Infographic features 5 human silhouette icons displaying 40%, 50%, 70%, 60%, and 90% through color gradients (white to turquoise to pink). 16:9 widescreen format, PPTX file type.
Related Products
-

Human Details Infographic Chart – Customer Analysis and Market Overview
#Market and Competitor Analysis #Graph #Other
-

Column Chart Visualization – Customer Analysis and Market Research
#Market and Competitor Analysis #Graph #Text Box
-

Key Personnel Work Competency Assessment Slide - Customer Analysis and Manpower
#Company Introduction #Market and Competitor Analysis #Diagram
-

Global User Status Analysis Graph – Data Visualization
#Market and Competitor Analysis #Graph #Other
