Bundled Charts for Infinite Energy Analysis
RJ0200051_17
- Last Update 04/13/2025
- File Size 0.3MB
- # of Slides 2
- File Format PPTX
- Slide Ratio 16:9
- Color
Keywords
- #Content-Based Slides
- #Design-Based Slides
- #Market and Competitor Analysis
- #Graph
- #Market Status
- #Future Outlook
- #Competitive Advantage
- #Column
- #Grouped Column
- #16:9
- #clustered column chart PowerPoint
- #multi-series bar chart template
- #time-series data comparison slide
- #how to create clustered chart in PowerPoint
- #data visualization PowerPoint slide download
About the Product
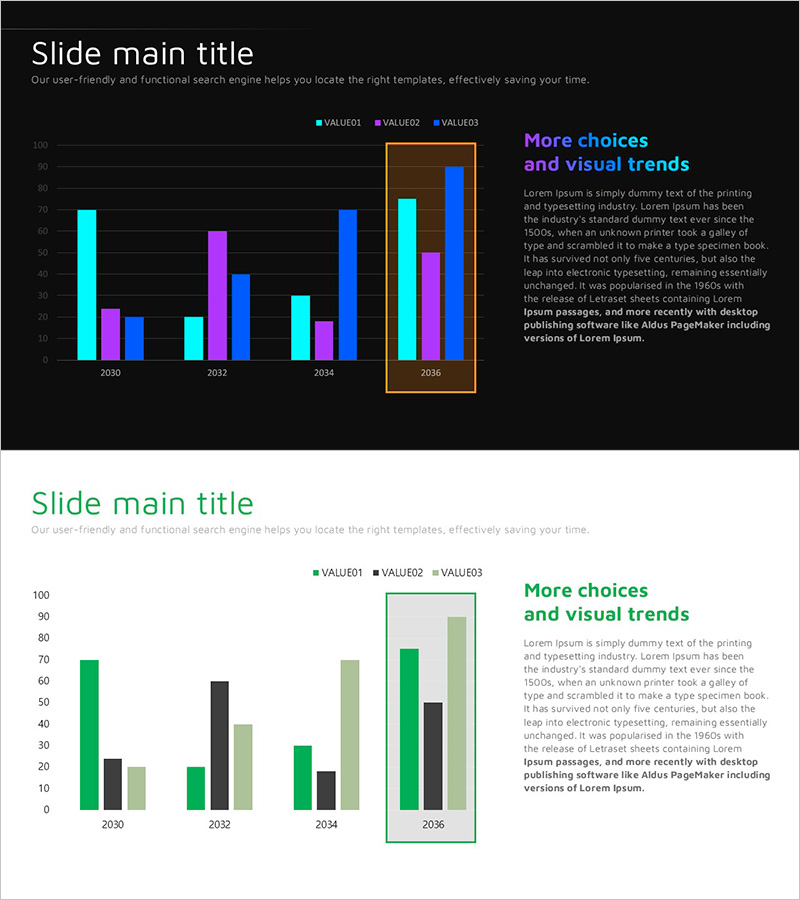
A clustered column chart PowerPoint slide designed to compare four data series across multiple time periods. This presentation template visualizes data from 2030 to 2036, displaying VALUE01, VALUE02, VALUE03, and additional metrics side-by-side for each year. The dark background combined with vibrant color coding (cyan, magenta, orange, blue) ensures clear data differentiation. A highlight box on the right emphasizes specific years or periods. Ideal for business presentations, market analysis, competitive benchmarking, and performance reporting. The slide deck is fully editable and ready for immediate use in executive presentations, investor pitches, and strategic planning sessions.
Usage Points
-
Main Usage
Visualize year-over-year or period-over-period performance of multiple metrics simultaneously. The clustered layout enables direct comparison of different data series at the same time point, while the highlight box draws attention to critical periods or outliers.
-
How to Use
Input your data into the chart, and the visualization updates automatically. Customize colors, axis ranges, and legend labels to match your brand guidelines. The highlight box position is adjustable. Insert directly into business reports, quarterly reviews, and board presentations.
-
Recommended For
Marketing teams analyzing campaign performance across channels, sales teams comparing quarterly results by region, finance teams tracking revenue metrics, and strategy teams monitoring market trends. Perfect for executive briefings, investor relations presentations, and cross-functional business reviews.
-
Slide Structure
Two-slide layout. Slide 1 features a dark background with a 4-series clustered column chart (2030–2036 timeline) and right-side highlight box. Slide 2 presents the same chart on a light background for contrast options. 16:9 widescreen format, PPTX file type, fully editable.
Related Products
-

Horizontal Bar Graph Slide Template for European Tourism Demand Survey
#Market and Competitor Analysis #Graph #Market Status
-

The Importance of Modern People's Health Care – Insights from Market Analysis
#Market and Competitor Analysis #Graph #Other
-

Analysis of Changes in Avocado Purchases with Horizontal and Vertical Bar Graphs
#Market and Competitor Analysis #Graph #Market Status
-

Muscle Mass Change Graph – Market Analysis Presentation
#Market and Competitor Analysis #Graph #Market Status
