Bar Chart for Portion of Meals – Visualizing Market Status
RJ0600069_6
- Last Update 07/08/2025
- File Size 4.6MB
- # of Slides 2
- File Format PPTX
- Slide Ratio 16:9
- Color
Keywords
About the Product
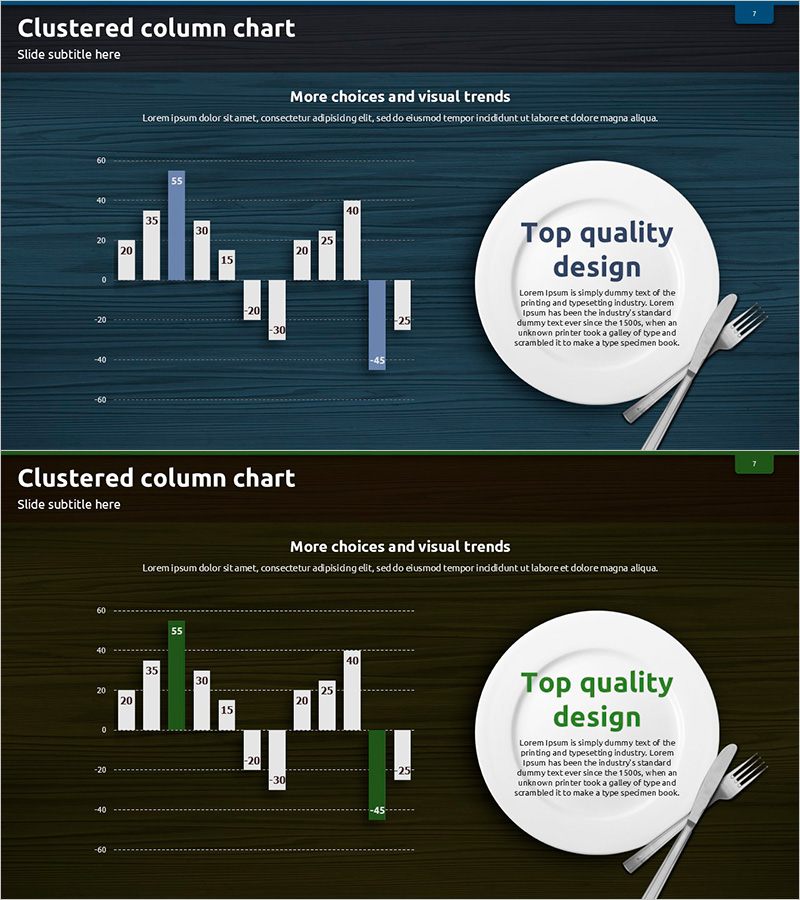
A professional PowerPoint slide featuring a positive-negative column chart designed to visualize market status and profit-loss analysis with clear data contrast. Set against a dark blue background, the chart uses white and color-coded columns to represent opposing data sets, with numerical labels displayed on each bar for precise information delivery. This 2-slide deck is ready to use for financial reports, market analysis, performance comparisons, and business presentations. Compatible with all devices in 16:9 widescreen PPTX format.
Usage Points
-
Main Usage
Display contrasting numerical data using a positive-negative column chart to communicate market trends, profit-loss analysis, performance metrics, and financial comparisons. The dark blue professional design enhances credibility for executive presentations and investor meetings.
-
How to Use
Insert into investor presentations, quarterly earnings reports, market analysis briefings, and financial strategy sessions to compare opposing metrics side-by-side. Replace sample data with actual figures and adjust colors to match your brand identity for immediate deployment.
-
Recommended For
CFOs, financial analysts, business managers, marketing strategists, and executives presenting quantitative data. Ideal for finance, consulting, manufacturing, and retail sectors requiring comparative financial or market analysis visualization.
-
Slide Structure
2-slide layout with one positive-negative column chart per slide. Each chart contains 5-8 data categories represented by white, blue, and green columns showing opposing values. Right side includes a circular text box for key message callouts and supporting commentary.
Related Products
-

Consumer Insights & Behavioral Patterns Analysis Slide
#Market and Competitor Analysis #Graph #Market Status
-

Horizontal Bar Chart for Recent Case Receipt Trends – Market Status
#Market and Competitor Analysis #Graph #Market Status
-

Data Visualization with Market Analysis Vertical Bar Graph
#Market and Competitor Analysis #Graph #Market Status
-

Strategic Market Analysis Bar Chart
#Market and Competitor Analysis #Graph #Market Status
