Eucalyptus Bending Line Chart – Market and Performance Analysis
RJ0600110_18
- Last Update 07/21/2025
- File Size 4.5MB
- # of Slides 2
- File Format PPTX
- Slide Ratio 16:9
- Color
Keywords
- #Content-Based Slides
- #Design-Based Slides
- #Business Strategy
- #Market and Competitor Analysis
- #Graph
- #Achievements
- #Future Outlook
- #Line
- #Line Chart
- #16:9
- #line chart PowerPoint slide
- #dual-series trend analysis
- #market analysis presentation template
- #performance metrics PPT
- #how to create line graph in PowerPoint
About the Product
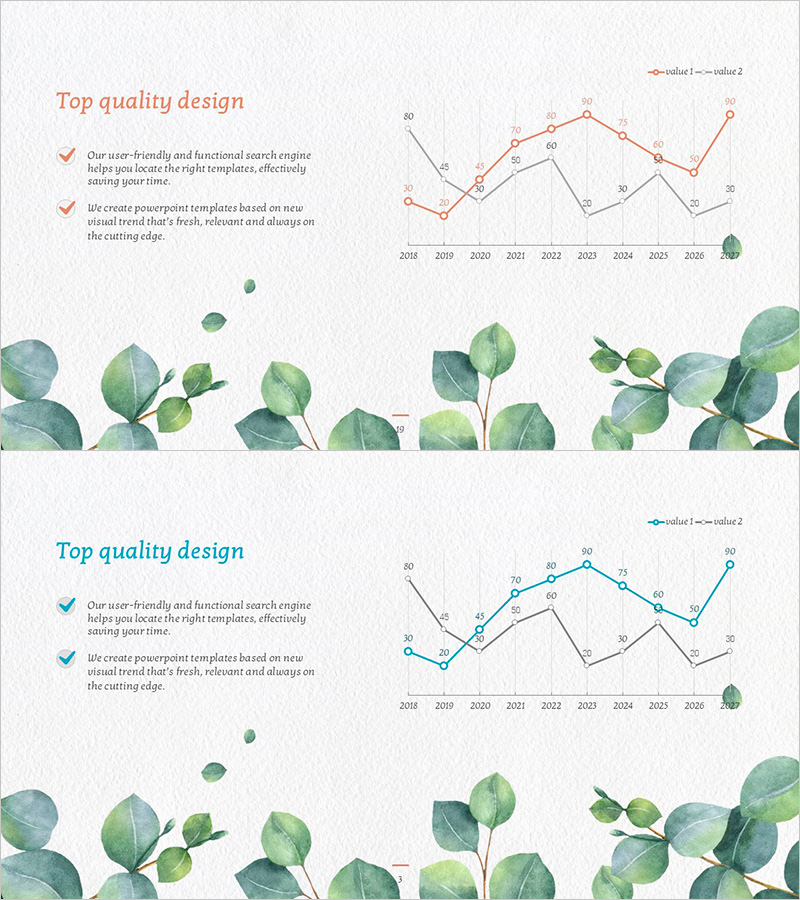
A 2-slide line chart PowerPoint template featuring eucalyptus botanical illustration as background design. The slides display dual-series data comparison with orange and gray lines tracking trends from 2018 to 2026, accompanied by checkmark text boxes for market analysis, competitive benchmarking, and performance metrics. Available in 16:9 widescreen PPTX format, fully editable and optimized for presenting year-over-year performance changes and comparative data analysis in business presentations.
Usage Points
-
Main Usage
Visualizes year-over-year trend changes and comparative analysis of two data series with clarity and impact. Ideal for presenting market growth rates, competitive performance benchmarks, quarterly revenue trends, and other time-series metrics where dual-line comparison enhances data storytelling.
-
How to Use
Replace the chart data points and numerical values with your actual analysis results. Edit the checkmark text boxes on the left side to include key insights, and update the chart legend and axis labels to match your presentation context. The template supports quick customization without requiring advanced design skills.
-
Recommended For
Executive performance reports, quarterly business reviews, market research presentations, competitive analysis briefings, investor relations meetings, and strategic planning sessions. Suitable for finance teams, marketing departments, strategy offices, and sales organizations presenting data-driven insights.
-
Slide Structure
Two-slide layout with consistent design. Each slide features a title section ('Top quality design'), two checkmark text boxes on the left, a dual-series line chart on the right (spanning 2018-2026 with approximately 9 data points per series), and eucalyptus botanical elements at the bottom. Chart legend displays 'value 1' (orange line) and 'value 2' (gray line) in the upper right corner.
Related Products
-

Blue Green Break Line Chart Analysis – Business Strategy and Market Analysis
#Business Strategy #Market and Competitor Analysis #Graph
-

Trends in Flower Market Size – Data-Driven Insights
#Business Strategy #Market and Competitor Analysis #Graph
-

Eco-friendly Business Project Line Graph – Embracing Sustainability
#Business Strategy #Market and Competitor Analysis #Graph
-

Orange Green Rising Numerical Graph – Performance and Future Outlook
#Business Strategy #Market and Competitor Analysis #Graph
