Trends in Flower Market Size – Data-Driven Insights
RJ0600104_7
- Last Update 07/19/2025
- File Size 0.4MB
- # of Slides 2
- File Format PPTX
- Slide Ratio 16:9
- Color
Keywords
- #Content-Based Slides
- #Design-Based Slides
- #Business Strategy
- #Market and Competitor Analysis
- #Graph
- #Achievements
- #Future Outlook
- #Line
- #Line Chart
- #16:9
- #line chart PowerPoint slide
- #market trends presentation
- #dual-series data visualization
- #market size template
- #how to create line graph in PowerPoint
About the Product
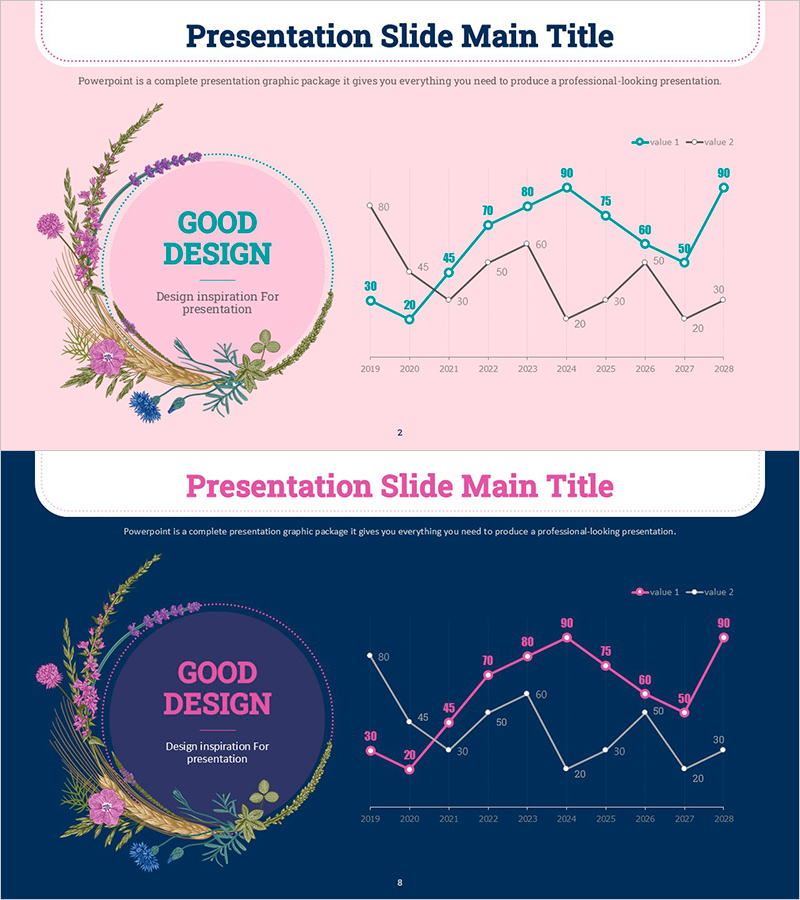
A dual-series line chart PowerPoint slide visualizing flower market size trends from 2019 to 2028. This presentation slide features two data series displayed in cyan and pink lines against pink and dark navy backgrounds, making it easy to compare market fluctuations at a glance. The 16:9 widescreen format includes 2 slides ready for immediate use in market analysis reports, performance reviews, and future outlook presentations. Data points are clearly marked with interactive chart elements for professional business communication.
Usage Points
-
Main Usage
Visualize time-series data comparing two or more metrics such as market size changes, performance trends, and future projections. Ideal for executive presentations, investor pitch decks, and marketing strategy reports where data-driven insights need to be communicated clearly to stakeholders.
-
How to Use
Simply input your data into the embedded chart, and the line graph updates automatically. Modify years, values, and series names to match your market data. Adjust background colors and line colors to fit your brand guidelines. Select the slides you need from the 2-slide set and customize as required for your presentation.
-
Recommended For
Business executives, market analysts, marketing managers, consultants, and data professionals presenting market analysis findings to C-suite executives or investors. Particularly effective for industries like agriculture, consumer goods, and retail where market size trends are critical to strategic decisions.
-
Slide Structure
Slide 1: Pink background with circular floral diagram and 'Good Design' text overlay. Slide 2: Dark navy background with identical dual-series line chart. X-axis spans 2019-2028, Y-axis ranges 0-90, two data series in cyan and pink, data point markers, and legend included.
Related Products
-

Trend in the Number of Crimes – Visual Data Analysis
#Business Strategy #Market and Competitor Analysis #Graph
-

Eucalyptus Bending Line Chart – Market and Performance Analysis
#Business Strategy #Market and Competitor Analysis #Graph
-

Blue Green Break Line Chart Analysis – Business Strategy and Market Analysis
#Business Strategy #Market and Competitor Analysis #Graph
-

Orange Green Rising Numerical Graph – Performance and Future Outlook
#Business Strategy #Market and Competitor Analysis #Graph
