Pixel Graphical Maps and Tables - Visualizing Global Network
RJ0600107_12
- Last Update 07/19/2025
- File Size 0.6MB
- # of Slides 2
- File Format PPTX
- Slide Ratio 16:9
- Color
Keywords
- #Content-Based Slides
- #Design-Based Slides
- #Company Introduction
- #Market and Competitor Analysis
- #Diagram
- #Other
- #Global Network
- #Market Analysis
- #Table
- #Standard Table
- #Map
- #16:9
- #world map PowerPoint slide
- #global network presentation template
- #map diagram PPT
- #international market analysis slide
- #pixel graphic PowerPoint template download
About the Product
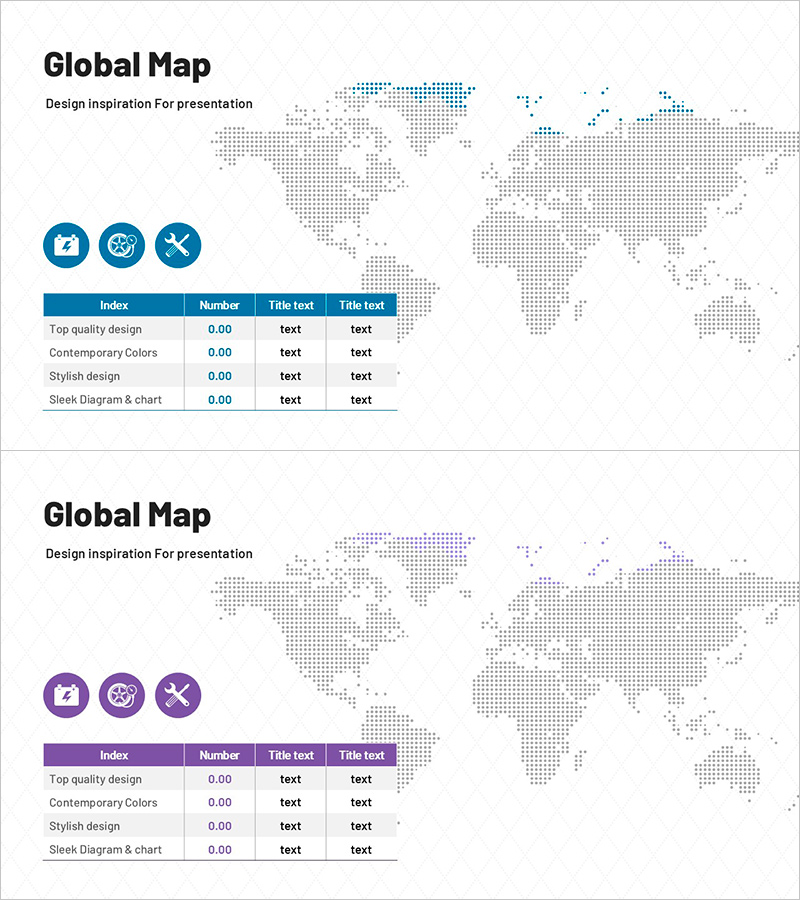
A PowerPoint slide set combining pixel-style world maps with data tables for global business presentations. The continents are rendered in gray dotted patterns with blue or purple accent colors applied to the header sections. The left side features a 4-row by 4-column information table, while the right side displays the full world map visualization. This design is optimized for international market analysis, global network presentations, and cross-regional data comparisons. The 2-slide set includes color variations (blue and purple) to adapt to different presentation contexts. Delivered in 16:9 widescreen PPTX format, fully editable and ready to customize.
Usage Points
-
Main Usage
Visualize spatial information and geographic data distribution for international business, global marketing strategy, and cross-regional market analysis presentations. The pixel-style design conveys a modern, tech-forward aesthetic ideal for technology companies, startups, and enterprises presenting global expansion strategies, international network infrastructure, and multi-country operational performance.
-
How to Use
Slide 1 features a blue-themed table header, while Slide 2 uses a purple-themed header, allowing you to differentiate sections or topics by color. The empty space to the right of the map can accommodate additional text, statistics, or callout boxes. Replace the placeholder numbers in the table with your actual regional data, and adjust the map annotations as needed for your specific geographic focus.
-
Recommended For
Global enterprise executives and strategy teams, international marketing managers, overseas business expansion project leaders, regional sales performance analysts, international conference presenters, and multinational corporation report writers preparing quarterly or annual business updates.
-
Slide Structure
Each slide divides the layout into two main sections: the right 2/3 displays a dotted-pattern world map in grayscale with continent-level detail; the left 1/3 contains a 4-row by 4-column data table (1 header row + 3 data rows, 4 columns). Three circular icons (briefcase, gear, airplane) appear above the table. Color-coded headers (blue or purple) provide visual distinction.
Related Products
-

Target Market Analysis Table
#Company Introduction #Market and Competitor Analysis #Diagram
-

Global Automotive Parts Management Service – Market Analysis and Strategy
#Company Introduction #Market and Competitor Analysis #Other
-

World Map Distribution Chart – Global Market Analysis Tool
#Company Introduction #Market and Competitor Analysis #Other
-

Infographic Design Wide Template Map&Table
#Market and Competitor Analysis #Financial Plans and Performance #Diagram
