Mobile Invitations and Graphs – Innovative Design for Market Analysis
RJ0800009_23
- Last Update 08/02/2025
- File Size 2.4MB
- # of Slides 2
- File Format PPTX
- Slide Ratio 16:9
- Color
Keywords
About the Product
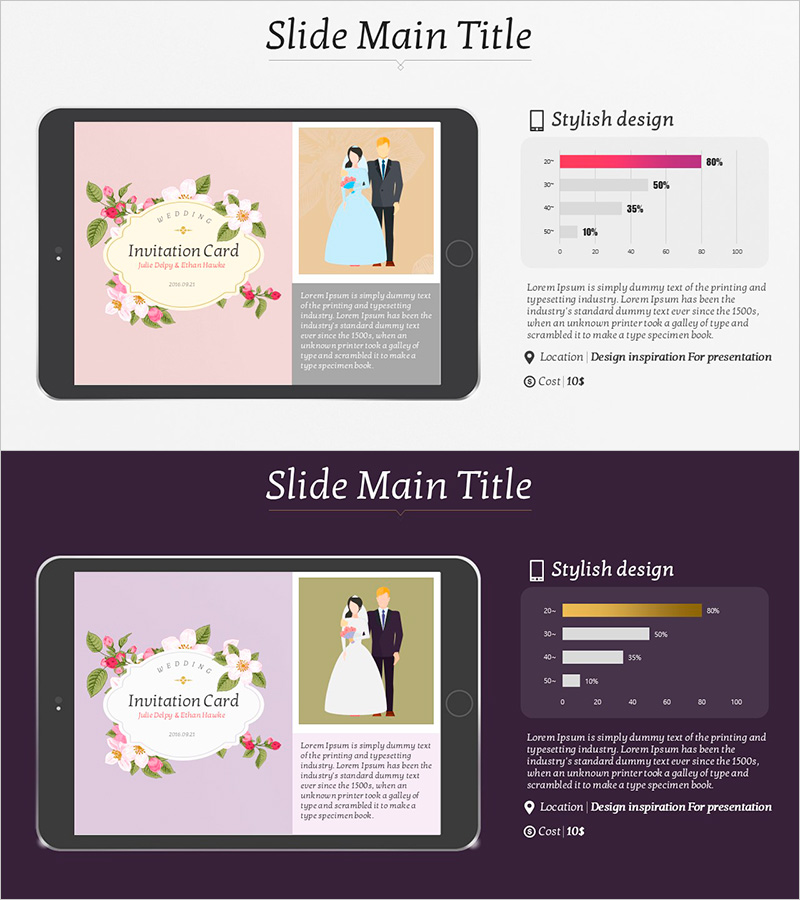
A 2-slide PowerPoint presentation combining a mobile invitation mockup with market analysis graphs. The left side features a pink floral illustration and invitation card design, while the right side displays three horizontal bar charts for data visualization. The bright background and colorful charts create strong visual impact, with ample text space for descriptions. This presentation slide is ready to use for event marketing, product launches, market analysis presentations, and various business scenarios requiring visual data representation.
Usage Points
-
Main Usage
Enhance visual impact in product introduction or event marketing presentations. Express quantitative data such as user response rates, market share, and customer satisfaction through pink-toned charts while conveying both brand image and data credibility simultaneously.
-
How to Use
Insert product images or service screenshots in the left invitation mockup area, and input market analysis figures (market share, growth rate, satisfaction scores) in the right graph section. Add key messages in text boxes to clearly communicate the meaning of the data.
-
Recommended For
Marketing managers, product planners, and business development teams presenting market analysis results to executives, investors, and partners. Particularly useful in mobile services, event planning, and consumer goods marketing sectors for data-driven decision-making.
-
Slide Structure
Two-column left-right split layout. Left side (approximately 40%) contains the invitation mockup and text description area, while right side (approximately 60%) displays three horizontal bar graphs with legends. Each graph is independently editable, allowing flexible modification of data values and labels.
Related Products
-

Bar Chart Visualizing Yacht Tour Satisfaction
#Market and Competitor Analysis #Graph #Other
-

Travel Preference Survey Slide – Market Status and Competitive Advantage
#Market and Competitor Analysis #Graph #Market Status
-

Family Camping Stack Horizontal Chart – Market Status and Competitive Advantage
#Market and Competitor Analysis #Graph #Market Status
-

Backpack Travel Vertical Bar Graph – Market Status and Competitive Advantage
#Market and Competitor Analysis #Graph #Market Status
