Infographic Design Wide Template Chart2 for Market Analysis
RJ0200064_20
- Last Update 10/17/2025
- File Size 0.3MB
- # of Slides 2
- File Format PPTX
- Slide Ratio 16:9
- Color
Keywords
- #Content-Based Slides
- #Design-Based Slides
- #Market and Competitor Analysis
- #Graph
- #Market Status
- #Competitive Advantage
- #Column
- #Column Chart
- #16:9
- #clustered column chart PowerPoint
- #market analysis chart template
- #competitive comparison slide
- #multi-series bar graph
- #data visualization presentation
- #how to create clustered chart in PowerPoint
About the Product
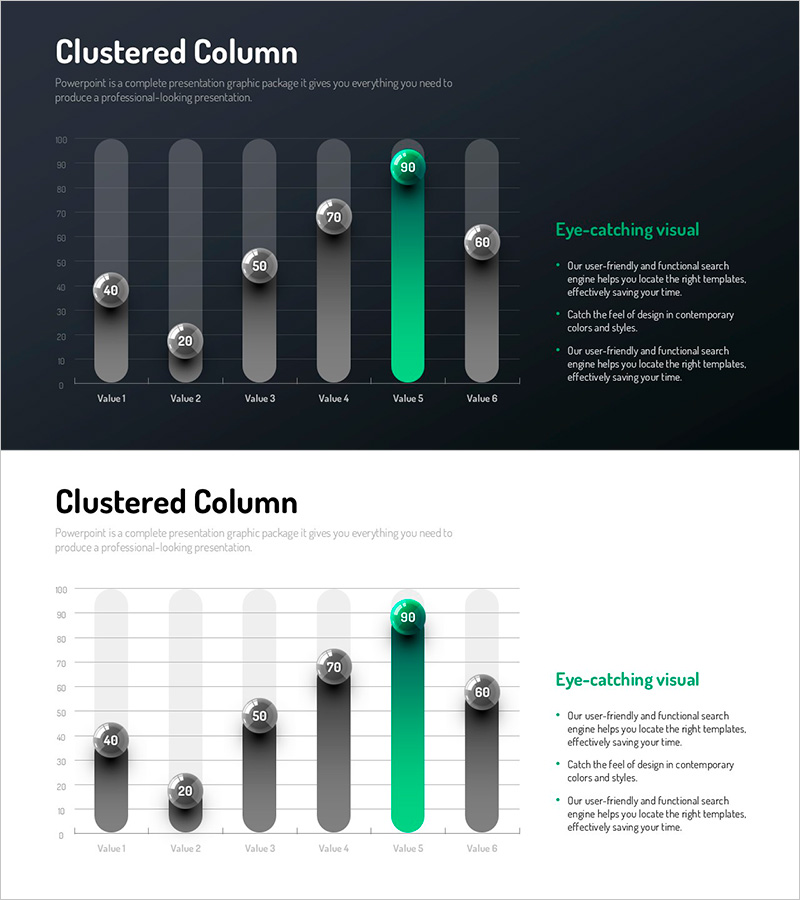
A clustered column chart PowerPoint slide optimized for market analysis and competitive comparison. This presentation template displays six data categories with multiple data series grouped side-by-side, enabling instant visual comparison of performance metrics across segments. The package includes two versions—dark background and light background—with turquoise accent colors highlighting key data points. Each column is labeled with precise numerical values for accurate data communication, making it ready for immediate use in business reports and presentations.
Usage Points
-
Main Usage
Ideal for comparing multiple data series across categories such as market analysis, competitive benchmarking, and performance evaluation. The grouped column layout allows viewers to quickly assess relative values and identify trends across different segments simultaneously.
-
How to Use
Insert into business plan market analysis sections, quarterly performance reports, and executive briefing materials. The column heights and color differentiation emphasize numerical differences, and when paired with supporting text, creates a compelling data-driven presentation.
-
Recommended For
Marketing managers, sales directors, executives, management consultants, and business analysts requiring data-driven decision-making. Applicable to market research presentations, product performance comparisons, customer satisfaction analysis, and competitive positioning reports.
-
Slide Structure
Six data categories (Value 1–6) positioned on the X-axis with a 0–100 numerical scale on the Y-axis. Each category displays 2–3 data series as grouped columns, with turquoise accent bars emphasizing key metrics. A text annotation area on the right side accommodates supporting insights and key takeaways.
Related Products
-

Backpack Travel Vertical Bar Graph – Market Status and Competitive Advantage
#Market and Competitor Analysis #Graph #Market Status
-

3D Bar Graph for Market Performance Analysis – Slide Highlighting Competitive Edge
#Market and Competitor Analysis #Graph #Market Status
-

Tourist Destination Preference Analysis – Stylish Bar Chart Design
#Market and Competitor Analysis #Graph #Market Status
-

Bar Chart Visualizing Yacht Tour Satisfaction
#Market and Competitor Analysis #Graph #Other
