Orange and Grapefruit Consumption Ratio – Visualized Performance Analysis
RJ0800007_22
- Last Update 08/01/2025
- File Size 1.6MB
- # of Slides 2
- File Format PPTX
- Slide Ratio 16:9
- Color
Keywords
- #Content-Based Slides
- #Design-Based Slides
- #Business Strategy
- #Market and Competitor Analysis
- #Graph
- #Achievements
- #Market Analysis
- #Horizontal Bar
- #Segmented Horizontal Bar
- #16:9
- #pie chart PowerPoint slide
- #consumption ratio presentation
- #comparative analysis graph
- #market analysis slide
- #performance data visualization
About the Product
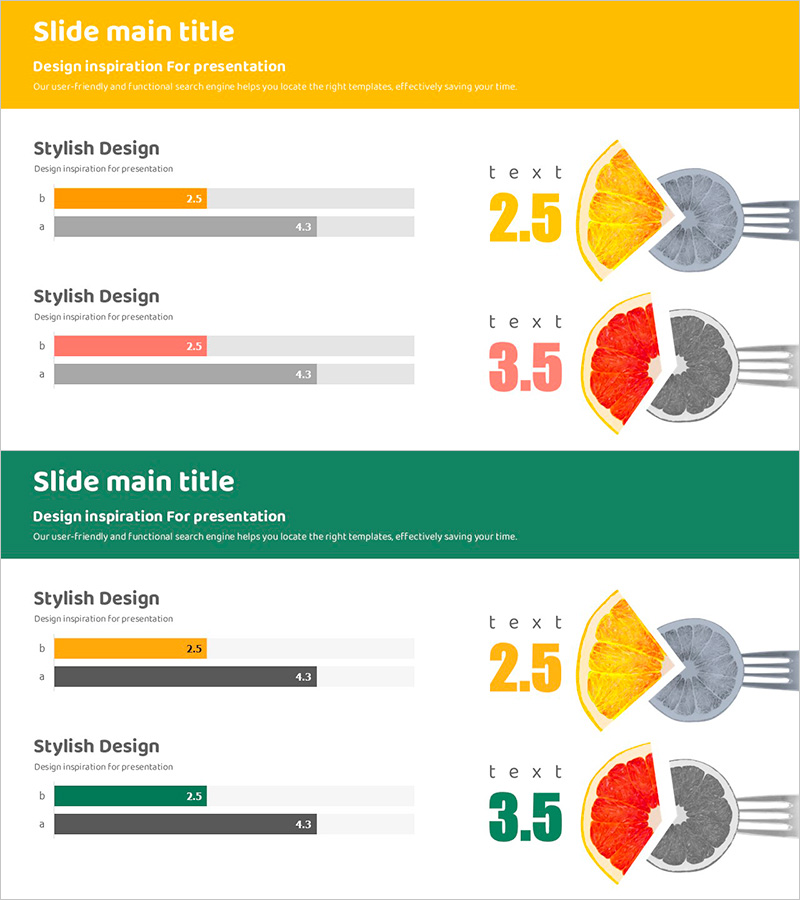
A PowerPoint slide that visualizes the consumption ratio of oranges and grapefruits using pie charts. The yellow and red pie charts clearly compare the consumption composition of both fruits, with numerical data (2.5, 3.5) positioned beside each chart to enhance information delivery. This dual data representation combining horizontal bar graphs and pie charts is ready to use for market analysis, performance analysis, and business strategy presentations. Composed of 2 slides in 16:9 widescreen format, colors and figures are fully editable to match your presentation needs.
Usage Points
-
Main Usage
Clearly express comparative analysis of product consumption ratios, market share, and sales composition using pie charts. Contrasting yellow and red colors intuitively distinguish each item, while numerical data display supports accurate information delivery and audience comprehension.
-
How to Use
Use in marketing strategy presentations, business performance reports, and market analysis materials to explain consumption patterns or sales ratios. Edit the title in the colored header area at the top, customize pie chart data and figures to match your presentation content, and adjust colors as needed.
-
Recommended For
Marketing managers, sales directors, business planning teams, and market analysts benefit when presenting consumption trends, product sales composition, and customer preferences. Particularly suitable for product comparison analysis presentations in food, beverage, and consumer goods industries.
-
Slide Structure
Composed of 2 slides, each featuring a colored header (yellow or green) at the top, horizontal bar graphs with 2 items (2.5 and 4.3 values) on the left center, and 2-color split pie charts (yellow-gray or red-gray) with numerical indicators on the right. Optimized for 16:9 widescreen format.
Related Products
-

Subdivided Graph for Analysis Results – Market Analysis and Customer Feedback
#Market and Competitor Analysis #Customer Success Stories #Graph
-

Detailed Bar Analysis Graph – Market and Competitor Insights
#Market and Competitor Analysis #Graph #Competitor Analysis
-

Aerobic Exercise System Diagram – Strategies for Effective Outcomes
#Product/Service Introduction #Business Strategy #Diagram
-

Market Analysis Bar Graph – Effective Visualization for Competitor Analysis
#Market and Competitor Analysis #Graph #Competitor Analysis
