Space Industry Development Status Graph – Key to Market Analysis
RJ0700013_20
- Last Update 07/25/2025
- File Size 1.7MB
- # of Slides 2
- File Format PPTX
- Slide Ratio 16:9
- Color
Keywords
- #Content-Based Slides
- #Design-Based Slides
- #Market and Competitor Analysis
- #Graph
- #Competitor Analysis
- #Market Analysis
- #Horizontal Bar
- #Segmented Horizontal Bar
- #16:9
- #horizontal bar chart PowerPoint
- #bar graph slide template
- #time-series data visualization
- #industry analysis chart
- #comparative data presentation
About the Product
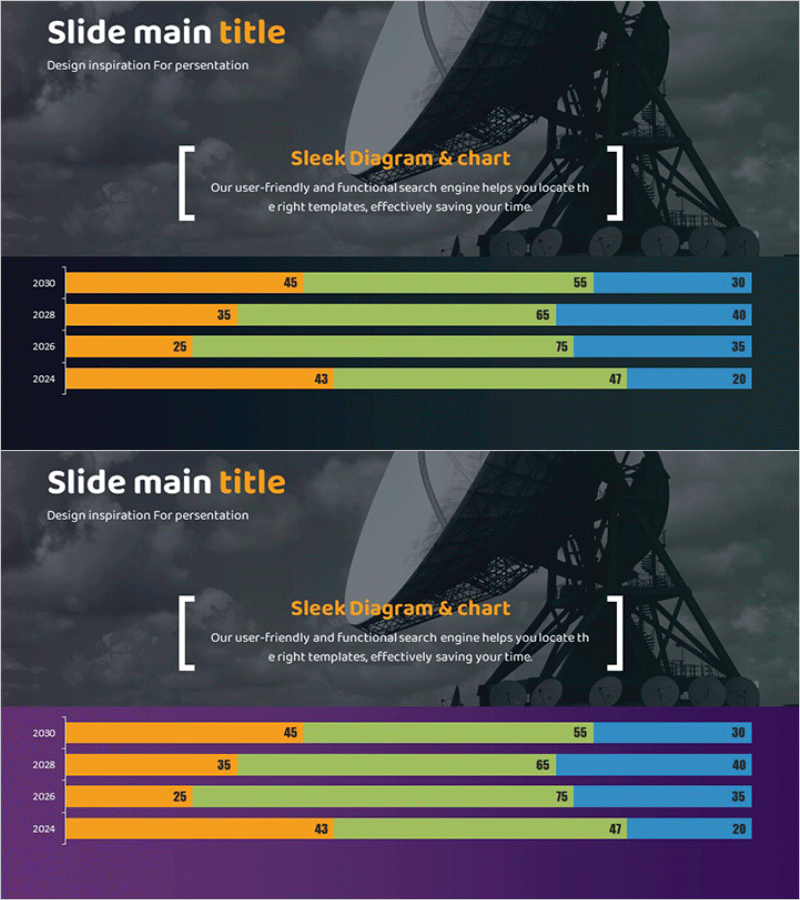
A horizontal bar chart PowerPoint slide visualizing space industry development status across four years (2024–2030) with three data series represented in orange, green, and blue. Each bar displays numerical values directly on the chart for precise comparison and analysis. The dark background with bright-colored bars creates high contrast, ensuring clear readability on projection screens and in large meeting rooms. This PowerPoint slide is ready to use for market analysis presentations, competitive benchmarking, industry trend reports, and data-driven business decision-making.
Usage Points
-
Main Usage
A horizontal bar chart slide designed for comparing and analyzing year-over-year and series-by-series numerical data. It visualizes industry development status (space, semiconductor, energy sectors) with direct numeric labeling for accurate comparison. Ideal for executive reports, investor presentations, and market analysis documents.
-
How to Use
Edit the bar lengths, colors, and data labels to match your dataset. Change years, category names, and values to repurpose the slide for various industry analyses. The dark background design maintains high brightness contrast on projector screens, making it suitable for large conference room presentations.
-
Recommended For
Executive and C-suite reports, investor pitch decks, industry analysis reports, market research presentations, and competitive benchmarking materials. Recommended for professionals in strategy, planning, marketing, and sales roles presenting technology sector development trends (space, semiconductors, energy, manufacturing).
-
Slide Structure
Two-slide set, each displaying four years (2024, 2026, 2028, 2030) as horizontal bars in three series (orange, green, blue). Numeric values (ranging 20–85) are labeled directly on bars for precise comparison. Dark background with bright-colored bars creates strong visual contrast and emphasis.
Related Products
-

Horizontal Bar Graph Broken Down by Year – Optimal for Market and Competitor Analysis
#Market and Competitor Analysis #Graph #Competitor Analysis
-

Business Service Analysis Segmentation Graph – Ideal for Market and Competitor Analysis
#Market and Competitor Analysis #Graph #Competitor Analysis
-

Market Analysis Bar Graph – Effective Visualization for Competitor Analysis
#Market and Competitor Analysis #Graph #Competitor Analysis
-

Body Organ Analysis Subdivision Graph - Market and Competitor Comparison
#Market and Competitor Analysis #Graph #Competitor Analysis
