Diagram Slide Visualizing the Process of Making Strawberry Juice
RJ0800007_19
- Last Update 08/01/2025
- File Size 1.2MB
- # of Slides 2
- File Format PPTX
- Slide Ratio 16:9
- Color
Keywords
About the Product
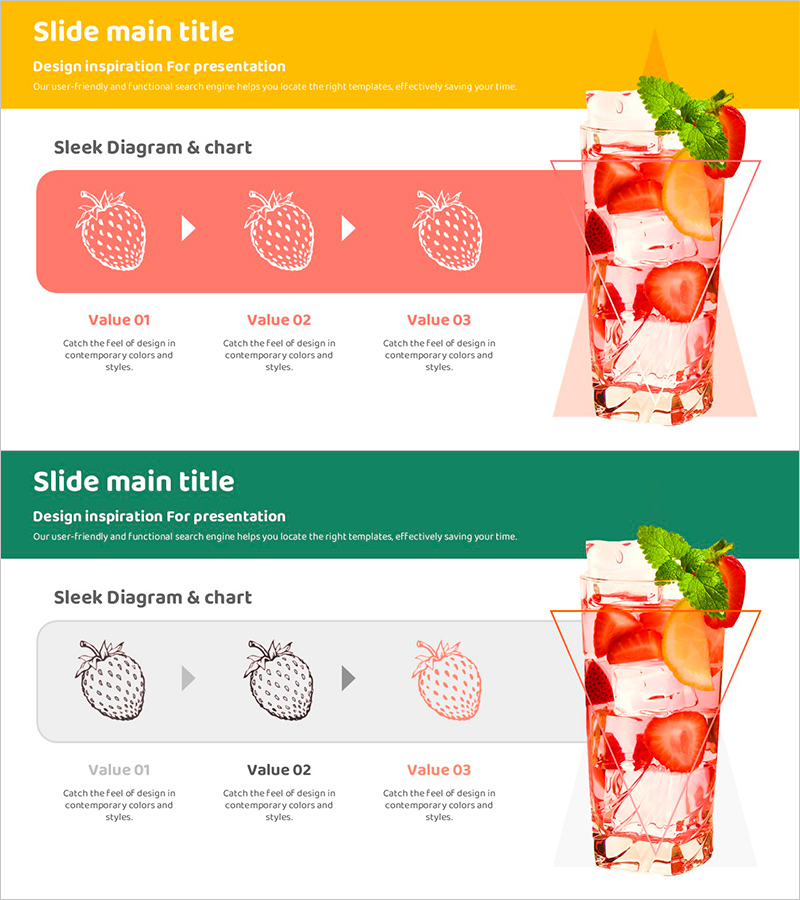
A 3-step linear diagram PowerPoint slide designed to visualize manufacturing processes, operational procedures, and workflow sequences. The arrow-connected icon-based node structure clearly expresses the core content of each stage. The coral background combined with white icons creates strong visual contrast for enhanced information delivery. Applicable beyond strawberry juice production to product development, service launches, and process improvement initiatives. Two slide variations with different background colors and styles allow you to match your presentation tone. Fully editable PPTX format for immediate customization.
Usage Points
-
Main Usage
Optimized for visually explaining manufacturing, production, and operational processes in sequential stages. Each step is represented through icons and text, enabling audiences to grasp the entire workflow at a glance. Applicable to product development stages, service launch procedures, process improvement roadmaps, and any scenario requiring linear flow visualization.
-
How to Use
Edit the text and icons in each node to match your specific process. The arrow direction flows left to right, clearly expressing time sequence and procedural order. Use the coral background version for warm-toned presentations and the green background version for corporate presentations requiring trust and credibility.
-
Recommended For
Operations managers and technical teams in manufacturing, food production, and chemical industries explaining production processes. R&D teams presenting new product development stages. Operations and quality management departments visualizing service improvement plans. Logistics professionals illustrating supply chain and distribution workflows.
-
Slide Structure
Three-node structure progressing left to right. Each node comprises a circular icon (strawberry, juice, finished product, etc.) and text area. Nodes connected by triangular arrows indicating stage progression. Descriptive text area for each stage positioned below. Two versions provided: coral background and green background variants.
Related Products
-

How to Measure Smart Health – Visualizing Effective Data Flow
#Operational Plan #Technical Approach #Diagram
-

Four Color Infographic Flow Linear Diagram – Visualizing Business Strategy
#Business Strategy #Operational Plan #Diagram
-

Yellow Speech Bubble Emphasis Diagram
#Operational Plan #Diagram #Production and Technology Development Strategy
-

Communication System Diagram – Effective Information Delivery
#Business Management #Operational Plan #Diagram
