Visualizing the IoT Service Process – Incorporating Business Strategy
RJ0400049_8
- Last Update 05/30/2025
- File Size 0.2MB
- # of Slides 2
- File Format PPTX
- Slide Ratio 16:9
- Color
Keywords
- #Content-Based Slides
- #Design-Based Slides
- #Business Strategy
- #Operational Plan
- #Diagram
- #Step-by-Step Schedule Plan
- #Business Processes
- #Flow
- #Cluster
- #Linear Flow
- #Chain Diagram
- #16:9
- #circular diagram PowerPoint
- #connection diagram template
- #4-stage process slide
- #IoT service architecture PPT
- #business process diagram PowerPoint
About the Product
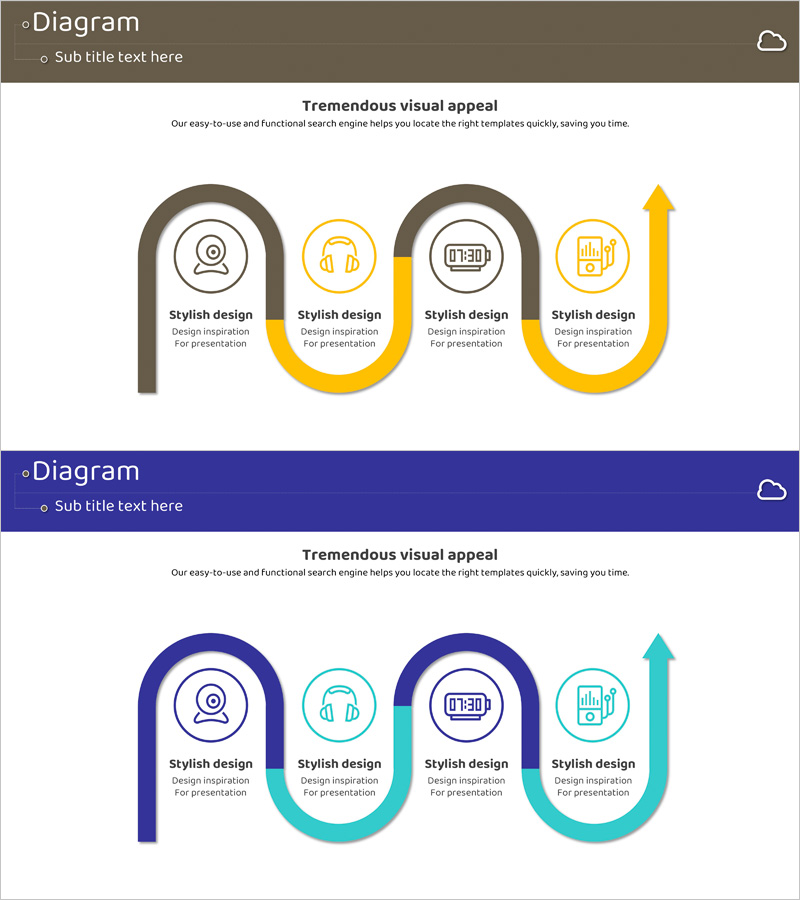
A PowerPoint slide visualizing the Internet of Things service process through a 4-stage circular connection structure. Four distinct colors—brown, yellow, blue, and cyan—differentiate each stage, while central icons and directional arrows clearly represent the process flow. Key elements such as user, technology, system, and data are positioned in circular nodes with connecting lines showing interdependencies. This PPT diagram is ready to use in various presentation scenarios including business strategy, operational planning, and service architecture explanation.
Usage Points
-
Main Usage
Express the IoT service process flow through a 4-stage circular structure to clearly communicate business strategy and operational framework. The design enables stakeholders to understand each stage's role and interconnected relationships at a glance.
-
How to Use
Apply this slide in business plans, investor pitch decks, and company profiles within the service architecture section. Edit node text and icons to match your business model, and adjust colors as needed for brand consistency.
-
Recommended For
IoT and smart technology companies, digital service startups, systems integration (SI) firms, technology managers in manufacturing, business planning teams, and marketing professionals presenting process explanations and strategic initiatives.
-
Slide Structure
2-slide set. First slide features a brown header with a yellow circular connection diagram containing 4 nodes with icons. Second slide presents a dark blue header with a cyan circular connection diagram in the same structure but different color scheme.
Related Products
-

Visualizing Daily Work Processes – Effective Operational Planning
#Business Strategy #Operational Plan #Diagram
-

Business Process Steps – Efficient Operational Strategy
#Business Strategy #Operational Plan #Diagram
-

Business Processes by Business Hours Slide – Efficient Operations Planning
#Business Strategy #Operational Plan #Diagram
-

Procedures for Applying for a Move-in of a Silver Town – Step-by-Step Flow Description
#Business Strategy #Operational Plan #Diagram
