Sophisticated Vertical Bar Chart – Market Trend Analysis
RJ0600086_16
- Last Update 07/13/2025
- File Size 0.3MB
- # of Slides 2
- File Format PPTX
- Slide Ratio 16:9
- Color
Keywords
- #Content-Based Slides
- #Design-Based Slides
- #Market and Competitor Analysis
- #Graph
- #Industry Trends
- #Competitive Advantage
- #Column
- #Column Chart
- #Segmented Column
- #16:9
- #vertical bar chart PowerPoint
- #bar graph slide template
- #data comparison chart
- #market analysis presentation
- #4-series chart download
About the Product
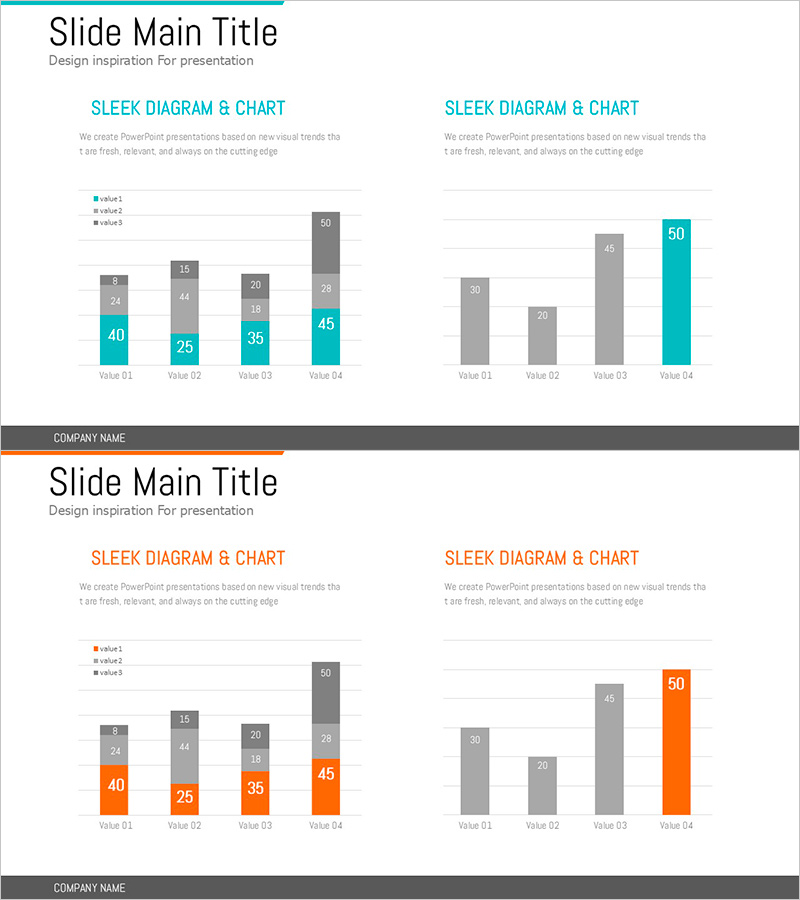
A vertical bar chart PowerPoint slide optimized for market trend analysis and competitive comparison. The design uses teal and gray tones to highlight key data points, enabling side-by-side comparison of four data series across time periods. The 2-slide set presents the same data structure in two color variations (teal and orange) for flexible presentation adaptation. Clear legends and data labels allow immediate editing, while the 16:9 widescreen format ensures compatibility with modern projectors and online presentations.
Usage Points
-
Main Usage
Visualizes multi-series numerical data such as quarterly or annual revenue, market share, and competitor benchmarks. The accent color (teal or orange) highlights critical metrics to focus audience attention, while legends and labels facilitate data interpretation.
-
How to Use
Use in business reports, marketing plans, investor presentations, and quarterly earnings calls to explain quantitative performance and market conditions. Select the color version matching your presentation theme, input your data values, and deploy immediately.
-
Recommended For
Ideal for finance and planning teams presenting performance analysis, sales teams explaining market trends, executive reports, and academic seminars visualizing statistical data. Suitable for any business presentation requiring quantitative evidence.
-
Slide Structure
Each slide contains a title area, descriptive text, and a vertical bar chart with 4 data series (value 1–3 plus one accent series). The X-axis displays 4 time units (Year 01–04), the Y-axis shows numerical scale, and the accent series is color-separated in teal or orange.
Related Products
-

3D Segmented Bar Graph for Performance Analysis – Market Trends
#Market and Competitor Analysis #Graph #Customer Analysis
-

Orange Export Trends Visualization Template – Market Growth
#Market and Competitor Analysis #Graph #Industry Trends
-

Pork Consumption Stack Chart – Market Trend Analysis
#Market and Competitor Analysis #Graph #Market Analysis
-

Sea Illustration Market Trend Chart – Visual Market Analysis
#Market and Competitor Analysis #Diagram #Graph
