Network Service Market Share Analysis with Doughnut Chart
RJ0400003_6
- Last Update 05/17/2025
- File Size 3.9MB
- # of Slides 2
- File Format PPTX
- Slide Ratio 16:9
- Color
Keywords
- #Content-Based Slides
- #Design-Based Slides
- #Market and Competitor Analysis
- #Graph
- #Market Share
- #Market Analysis
- #Circles
- #Doughnut Chart
- #16:9
- #doughnut chart PowerPoint
- #pie chart slide template
- #market share analysis diagram
- #4-segment donut chart
- #percentage visualization PPT
- #how to create doughnut chart in PowerPoint
About the Product
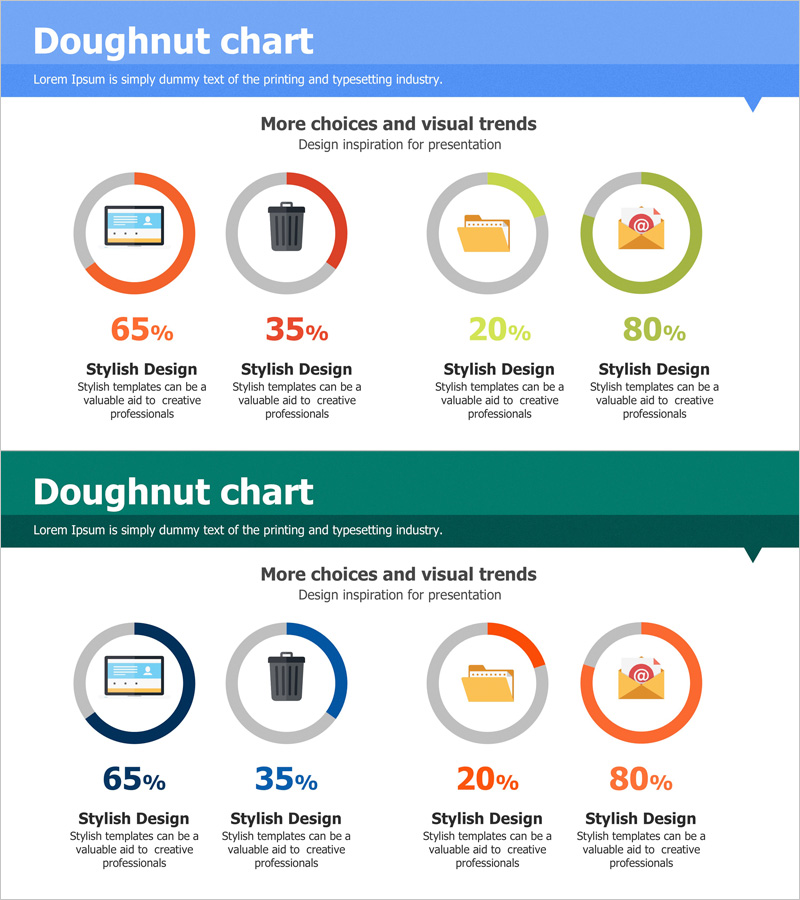
A 2-slide PowerPoint presentation featuring doughnut charts for visualizing network service market share distribution. The circular graphs are divided into four segments using orange, red, yellow, and green colors, with centered icons and percentage values for clear data representation. Each slide presents the same chart structure with different color variations, making it ideal for market analysis, competitive benchmarking, and customer preference studies in business presentations.
Usage Points
-
Main Usage
Visualize network service, telecommunications, and software market share distribution using doughnut charts to clearly communicate market position and competitive landscape to executives, investors, and stakeholders. The four color-coded segments enable instant recognition of each service's market proportion.
-
How to Use
Slide 1 features a blue header with doughnut chart; Slide 2 displays a dark teal header with the same chart structure. Edit the percentage values and center icons with your actual market data, then use for market analysis presentations, quarterly performance reports, and competitive landscape analysis.
-
Recommended For
Marketing managers, business strategists, executives, investment professionals, and consultants presenting market analysis, customer preference surveys, sales channel distribution, and brand awareness comparisons. Particularly suitable for IT, telecommunications, finance, and retail industries during quarterly reviews and strategic planning meetings.
-
Slide Structure
2-slide set. Slide 1: Blue header + 4-segment doughnut chart (orange, red, yellow, green) + centered icon + percentage values (65%, 35%, 20%, 80%). Slide 2: Dark teal header + variant-colored doughnut chart (dark blue, blue, orange tones) + centered icon + percentage values. 16:9 widescreen format, PPTX file.
Related Products
-

Analyzing ABC District Occupancy with Doughnut Chart
#Market and Competitor Analysis #Graph #Other
-

Soccer Match Analysis Chart – Performance Analysis and Future Forecast
#Business Vision and Strategy #Market and Competitor Analysis #Graph
-

Red Market Share Slide – Compelling Donut Chart Design
#Market and Competitor Analysis #Graph #Market Share
-

Competition and Cooperation Donut Charts
#Market and Competitor Analysis #Graph #Market Share
