Product Comparison Radar Chart – Competitive Advantage Analysis
RJ0800002_23
- Last Update 07/31/2025
- File Size 1.1MB
- # of Slides 2
- File Format PPTX
- Slide Ratio 16:9
- Color
Keywords
- #Content-Based Slides
- #Design-Based Slides
- #Product/Service Introduction
- #Market and Competitor Analysis
- #Graph
- #Features
- #Competitive Advantage
- #Other
- #Radar Chart Spider Chart
- #16:9
- #radial chart PowerPoint
- #radar chart slide template
- #5-axis diagram
- #product comparison slide
- #competitive analysis PPT
About the Product
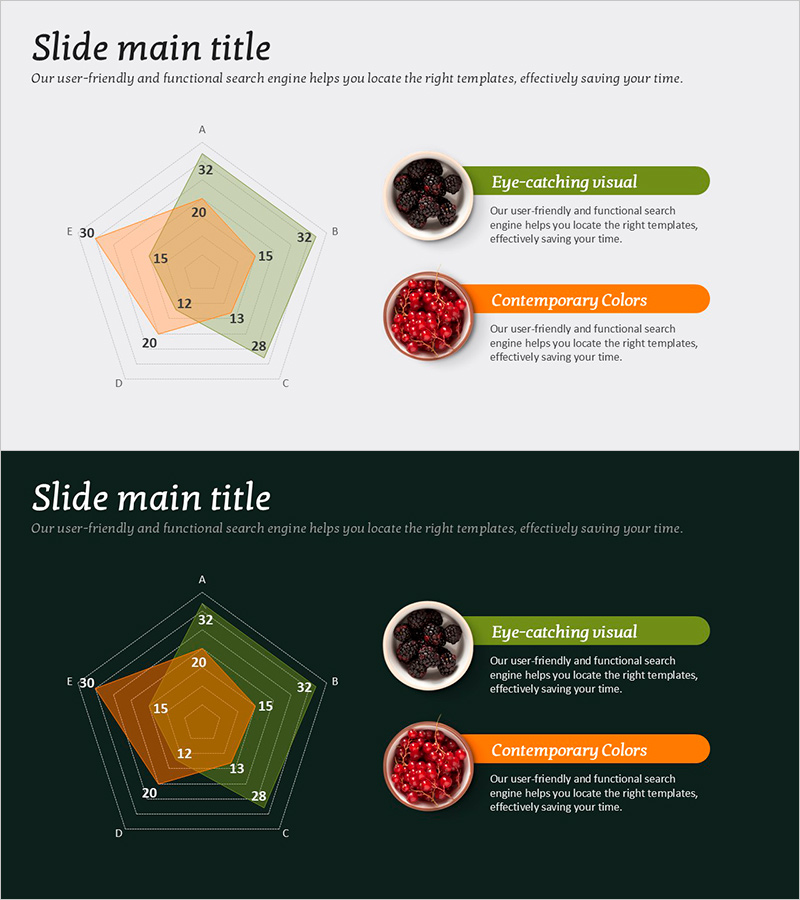
A radial radar chart PowerPoint slide that visualizes five key metrics in a pentagon structure. Two versions are provided—light background and dark background—enabling clear numerical representation across all dimensions. Multi-color gradients in orange, green, and beige differentiate data series, while product imagery (berries, pomegranate) and descriptive text boxes enhance visual impact. This presentation slide is ready to use for competitive advantage analysis, product feature comparison, and market positioning discussions.
Usage Points
-
Main Usage
This chart compares five key metrics across products, services, or competitors in a radial structure. Strengths and weaknesses become immediately visible, supporting strategic decision-making during market positioning and planning phases. Multi-color gradients clearly distinguish data series, making complex information intuitive and persuasive.
-
How to Use
Insert this slide into marketing plans, business reports, and investor presentations in the product comparison section. Input your numerical data directly, and the chart updates automatically. Select the background version (light or dark) that matches your presentation environment. Replace the product image area with actual product photos for greater credibility.
-
Recommended For
Ideal for marketing and product teams analyzing competitive positioning, sales teams presenting competitive comparisons, executive reports on market analysis, and investor pitch decks highlighting competitive advantages. Particularly effective in B2B proposals and consulting reports where data-driven decision-making must be visualized.
-
Slide Structure
Two-slide set featuring a 5-axis radial radar chart. Each slide contains a central pentagon node (displaying five metric values), five axis lines, three data series (orange, green, beige gradients), and right-aligned text boxes with descriptions and product imagery. Light and dark background versions provide flexibility for different presentation contexts.
Related Products
-

Comparable Filled Radial Chart – Intuitive Data Analysis
#Product/Service Introduction #Market and Competitor Analysis #Diagram
-

Two Radial Graphs for Product Feature Comparison – Highlighting Competitive Advantage
#Product/Service Introduction #Market and Competitor Analysis #Graph
-

Fantastic Wide PPT Radar Chart – Visualizing Product Features and Benefits
#Product/Service Introduction #Graph #Product/Service Introduction
-

Introducing Product Features with Advanced Radar Chart
#Product/Service Introduction #Graph #Features
