Visualizing Causes of Workplace Stress with Horizontal Bar Graph
RJ0800004_27
- Last Update 08/01/2025
- File Size 0.5MB
- # of Slides 2
- File Format PPTX
- Slide Ratio 16:9
- Color
Keywords
About the Product
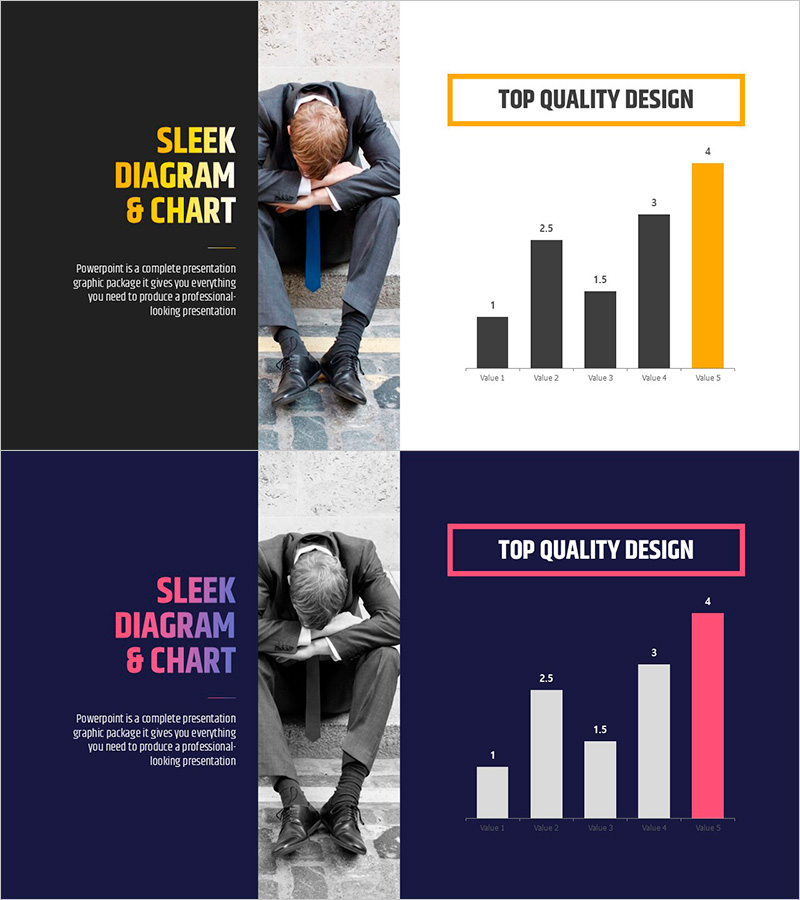
A professional PowerPoint slide featuring a 5-item horizontal bar chart that compares workplace stress factors with quantitative data. The design uses a two-tone color scheme of charcoal and golden yellow to highlight the peak value, with clear numerical labels for easy interpretation. The 2-slide set includes both dark gray and dark navy background versions, allowing flexible integration into HR reports, employee satisfaction surveys, and organizational culture assessments. Ready-to-edit format for immediate use in presentations.
Usage Points
-
Main Usage
Effectively communicate quantitative workplace stress data and prioritize factors for organizational decision-making. Ideal for presenting employee survey results, organizational culture diagnostics, and HR policy recommendations to executives and team leaders.
-
How to Use
Select the appropriate background version (dark gray or navy) based on your presentation theme. Replace the default values and labels with your actual survey data. Modify the yellow highlight bar to emphasize different priority items as needed. All elements are fully editable in PowerPoint.
-
Recommended For
HR professionals, organizational development specialists, management consultants, employee engagement teams, and executives presenting workplace wellness initiatives. Suitable for annual organizational assessments, employee satisfaction reports, and workplace improvement proposals.
-
Slide Structure
Horizontal bar chart with 5 data items (Value 1 through Value 5) displaying numerical values ranging from 1 to 4. The final bar is highlighted in golden yellow to emphasize the highest value. Includes a title header box and two background color variations for presentation flexibility.
Related Products
-

Bar Graph of Favorite Subjects – Data Visualization
#Market and Competitor Analysis #Graph #Customer Analysis
-

Consumer Insights & Behavioral Patterns Analysis Slide
#Market and Competitor Analysis #Graph #Market Status
-

Customer Type Analysis Bar Graph – Data Visualization for Customer Success
#Company Introduction #Market and Competitor Analysis #Customer Success Stories
-

Human Details Infographic Chart – Customer Analysis and Market Overview
#Market and Competitor Analysis #Graph #Other
