Pie Chart Slide for Bylaws Survey
RJ0800004_26
- Last Update 08/01/2025
- File Size 0.2MB
- # of Slides 2
- File Format PPTX
- Slide Ratio 16:9
- Color
Keywords
About the Product
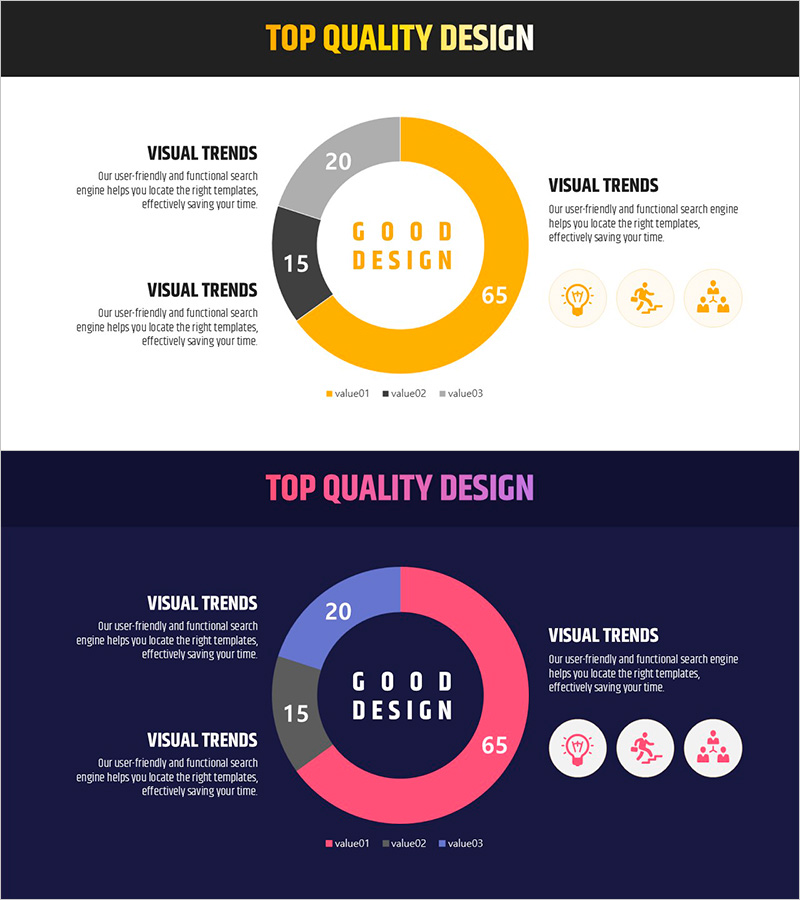
A professional pie chart PowerPoint slide optimized for policy surveys, compliance reports, and statistical presentations. The three-segment design uses golden, gray, and black colors to clearly distinguish data proportions and make comparisons intuitive. Two slide layouts are included—one with a light background for printed documents and one with a dark background for projector presentations. Each slide features dedicated text areas on the left for detailed explanations, allowing you to present survey findings, statistics, and interpretations side by side with the visual. Fully editable PPTX format lets you customize data values, labels, and percentages instantly.
Usage Points
-
Main Usage
Visualize survey results, statistical data, and composition ratios using a pie chart that enables audiences to grasp proportions at a glance. Compare three data categories—such as compliance rates, satisfaction scores, or allocation percentages—with clear visual hierarchy.
-
How to Use
Open the slide and replace the default values and labels with your own data. The golden, gray, and black color scheme can be retained or adjusted as needed. Use the light background version for printed reports and PDFs; use the dark background version for live projector presentations.
-
Recommended For
Policy officers, compliance teams, HR departments, and auditors presenting internal policy adherence, employee satisfaction, or organizational composition. Also suitable for academic presentations, market research reports, and budget allocation discussions.
-
Slide Structure
Two-slide set. Each slide features a central three-segment pie chart (65% primary segment, 20% secondary segment, 15% tertiary segment) with text explanation areas on the left and three supporting icons on the right. Clear legends and percentage labels are pre-formatted.
Related Products
-

Writing Instrument Icon Horizontal Bar Chart – Market and Technology Overview
#Business Introduction #Market and Competitor Analysis #Graph
-

Gender Ratio Customer Analysis Pie Chart – Emphasizing Customer Insights
#Market and Competitor Analysis #Graph #Other
-

User Analysis Bar Graph – Providing Customer Insights
#Market and Competitor Analysis #Graph #Customer Analysis
-

Mokup and Turnout Analysis Chart – Analyze with Visual Data
#Market and Competitor Analysis #Graph #Other
