Donut Chart by Sales Ratio – Market Share Analysis
RJ0800040_16
- Last Update 08/11/2025
- File Size 0.3MB
- # of Slides 2
- File Format PPTX
- Slide Ratio 16:9
- Color
Keywords
About the Product
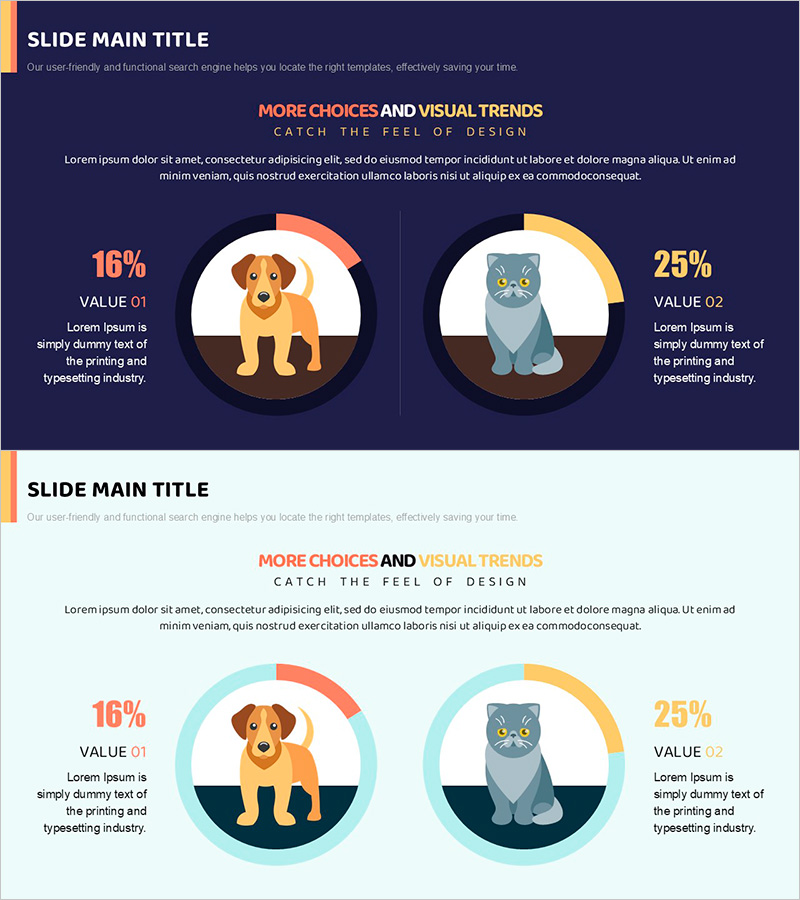
A 2-slide donut chart PowerPoint presentation template for visualizing market share and sales ratio data side by side. Featuring a dark navy background with orange and yellow gradient donut graphs, this slide deck enables clear comparison of two data categories simultaneously. Each donut chart displays percentage values and descriptive text labels, with illustrative icons (dog and cat) for category differentiation. The 16:9 widescreen PPTX format is fully editable and ready to use in marketing reports, sales presentations, and strategic business meetings where ratio-based data visualization is essential.
Usage Points
-
Main Usage
Visualize and compare two categories of ratio data such as market share, sales distribution, and customer composition simultaneously. The donut chart format delivers strong visual impact while percentage values and labels ensure clear information delivery to your audience.
-
How to Use
Insert this slide into market analysis sections of marketing reports, sales performance presentations, and strategic business meetings. Double-click the donut chart elements to edit colors and values, customizing the template to match your specific data and branding requirements.
-
Recommended For
Marketing teams analyzing market share and competitive positioning, sales teams presenting customer segment distribution, executive leadership reviewing ratio-based metrics, and product planning teams comparing target audience demographics. Ideal for any presentation requiring side-by-side ratio comparison.
-
Slide Structure
2-slide template with dual donut charts positioned left and right on each slide. Charts feature orange and yellow gradient segments, with percentage labels (16%, 25%, etc.) and 'VALUE 01·02' indicators. Description text areas below each chart allow for additional context and interpretation of the data presented.
Related Products
-

Equipment Demand Configuration Graph – Effective Visualization for Market Analysis
#Market and Competitor Analysis #Diagram #Graph
-

Logistics Donut Chart – Performance and Market Shares
#Business Strategy #Market and Competitor Analysis #Diagram
-

Donut Chart Visualizing Merchandise Sales Proportion
#Market and Competitor Analysis #Graph #Market Share
-

Travel Agency Market Share and Trends – Data Slide for Competitive Advantage
#Market and Competitor Analysis #Diagram #Graph
