Gender-Based Work Stress Survey Results Slide Template
RJ0800004_23
- Last Update 08/01/2025
- File Size 8.3MB
- # of Slides 2
- File Format PPTX
- Slide Ratio 16:9
- Color
Keywords
About the Product
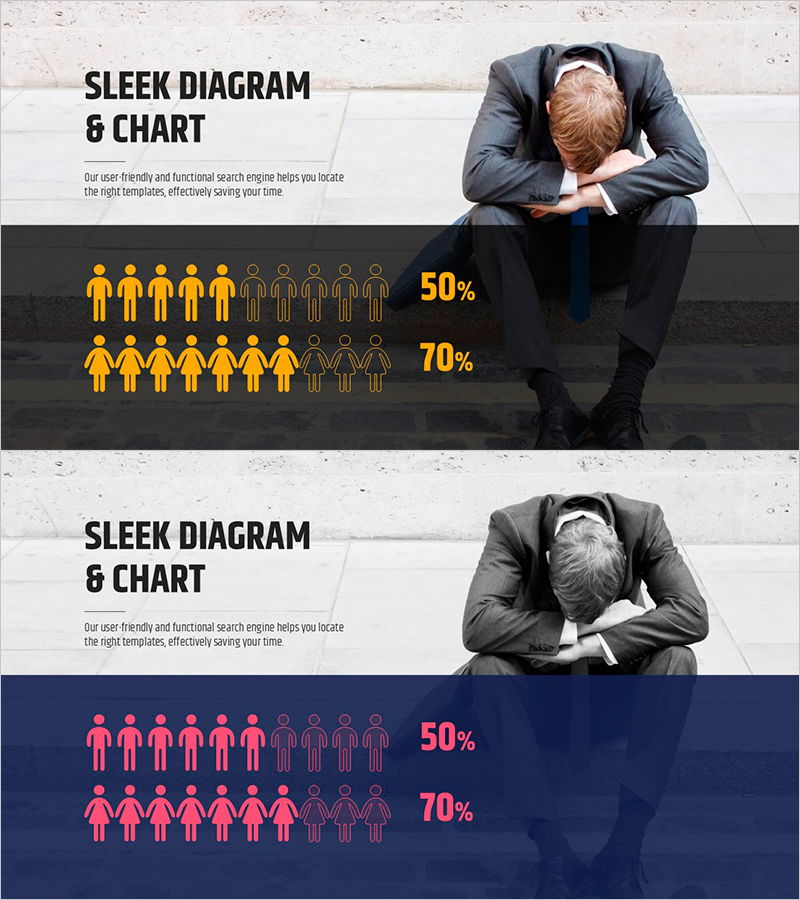
A PowerPoint slide template that visually compares gender-based workplace stress survey results using a two-row infographic layout. The design features golden-yellow icons and figures against a dark background, creating strong contrast for optimal data readability. Provided in 16:9 widescreen PPTX format, this slide is ready to integrate into company presentations, marketing reports, market analysis documents, and HR briefings. The clearly defined text and data input areas allow you to quickly customize the slide with your own survey findings and percentages.
Usage Points
-
Main Usage
Present quantitative gender-based workplace stress comparisons to stakeholders, investors, and team members. This infographic-style slide transforms complex survey data into clear visual insights that support HR decisions, organizational planning, and strategic recommendations.
-
How to Use
Insert this slide into company culture sections of corporate presentations, target audience analysis in marketing plans, or organizational health reports. Replace the golden percentages and icon counts with your actual survey data, then edit the title and descriptive text to match your presentation context.
-
Recommended For
HR professionals, marketing strategists, market research analysts, organizational development managers, management consultants, and executives presenting employee satisfaction surveys, workplace culture assessments, or demographic market analysis.
-
Slide Structure
Two-slide template with each slide divided into three zones: title area (top-left), descriptive text field (left side), and infographic area (right side). The infographic displays two rows of 10 icons each with corresponding percentage values, accommodating up to two data comparisons side-by-side.
Related Products
-

Gender Ratio Analysis of Coffee Consumers - Consumption Patterns of Men and Women
#Market and Competitor Analysis #Graph #Other
-

Infographic Slide for User Gender Analysis
#Market and Competitor Analysis #Graph #Other
-

Travel Business Target Market and Customer Analysis Slide
#Market and Competitor Analysis #Graph #Other
-

Environmental Protection Chart Diagram – Vision for Sustainable Development
#Market and Competitor Analysis #Graph #Other
