Customer Analysis Donut Chart - Visualizing Market Share
RJ0600013_8
- Last Update 06/24/2025
- File Size 1.7MB
- # of Slides 2
- File Format PPTX
- Slide Ratio 16:9
- Color
Keywords
- #Content-Based Slides
- #Design-Based Slides
- #Market and Competitor Analysis
- #Graph
- #Other
- #Customer Analysis
- #Market Share
- #Circles
- #Doughnut Chart
- #16:9
- #donut chart PowerPoint
- #pie chart comparison slide
- #market share visualization
- #customer analysis presentation
- #dual donut graph template
- #ratio comparison slide download
About the Product
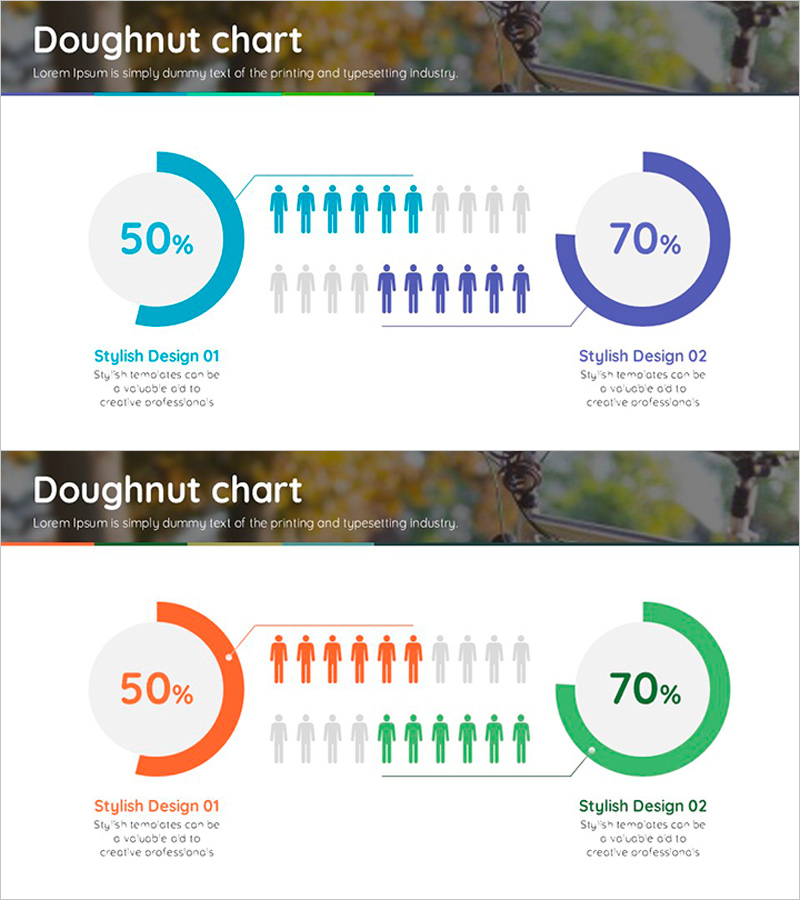
A professional dual donut chart PowerPoint slide designed for customer analysis and market share visualization. Two donut graphs in cyan and navy blue (or orange and green) are positioned symmetrically to compare two groups side by side. Each chart displays a percentage value in the center, with human icons below representing customer composition or demographic breakdown. Descriptive text areas beneath each chart allow for detailed explanations of group characteristics. Provided in 16:9 widescreen format across 2 slides, with fully editable colors, percentages, and text for immediate use in business presentations, competitive analysis, and stakeholder reports.
Usage Points
-
Main Usage
Compare two customer segments, market share distribution, sales channel performance, or demographic groups side by side. The donut format with center space emphasizes key metrics, while human icons visually represent customer composition and scale. Ideal for highlighting relative proportions and contrasting two major categories.
-
How to Use
Enter the first group's percentage in the left donut chart and the second group's percentage in the right chart. Adjust the number of human icons below each chart to represent customer count or composition ratio. Update the descriptive text areas with group characteristics, strategies, or insights. Modify colors to match your brand guidelines using PowerPoint's shape fill options.
-
Recommended For
Marketing professionals presenting customer segmentation analysis, sales leaders comparing channel performance, executives reviewing market share reports, consultants conducting competitive analysis, and business analysts presenting demographic breakdowns. Effective for any presentation requiring side-by-side comparison of two major groups.
-
Slide Structure
Each slide contains a title area at the top, two symmetrically positioned donut charts in the center (each with a single arc and percentage value), a row of approximately 10 human icons below each chart, and descriptive text fields at the bottom. Both slides maintain identical layout with color variations for visual distinction.
Related Products
-

Market Share Donut Pie Chart & Silhouette – Unique Design and Information Delivery
#Market and Competitor Analysis #Graph #Other
-

Customer Analysis and Market Share Graph – Harmony of Blue and Red
#Market and Competitor Analysis #Graph #Other
-

Customer Share Analysis Chart – Insights for Successful Business
#Market and Competitor Analysis #Graph #Other
-

Consumer Analysis Donut & Mixed Chart – Insights into Customers
#Business Introduction #Market and Competitor Analysis #Graph
