Marketing Survey Results – Data Visualization Graph
RJ0800004_17
- Last Update 07/31/2025
- File Size 1.2MB
- # of Slides 2
- File Format PPTX
- Slide Ratio 16:9
- Color
Keywords
About the Product
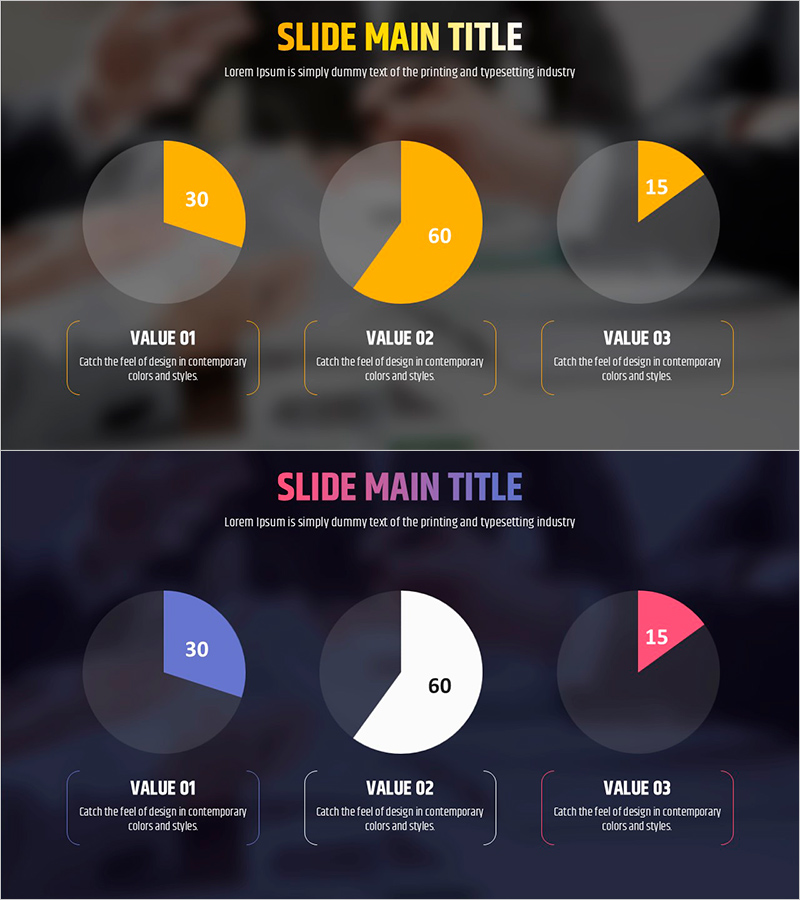
A professional pie chart PowerPoint slide designed to present marketing survey results and data analysis effectively. The slide features three pie charts displaying proportional data (30%, 60%, 15%), with gold accent colors contrasting against dark backgrounds for clear emphasis. Each chart includes a labeled description area below for contextual information. Composed of 2 slides in 16:9 widescreen format, this template is optimized for all presentation environments. Ideal for survey results, market analysis, customer satisfaction reports, and quantitative data presentations that require intuitive visual communication.
Usage Points
-
Main Usage
Designed to visualize survey results, market research, and customer satisfaction data through proportional pie charts. Enables stakeholders to grasp composition ratios at a glance, making it ideal for marketing reports, business analysis documents, and executive briefings.
-
How to Use
Enter survey item names and descriptions in the VALUE sections below each pie chart. The percentage values (30%, 60%, 15%) are fully editable to match your actual data, and colors can be customized to align with brand guidelines. The three-chart horizontal layout allows simultaneous comparison of multiple survey items.
-
Recommended For
Marketing professionals, market research analysts, executives, consultants, and data analysts presenting quantitative findings to leadership or clients. Particularly effective when communicating complex data in an intuitive, visually compelling format.
-
Slide Structure
2-slide template with 3 pie charts arranged horizontally on each slide. First slide features gold accent emphasis; second slide uses blue, white, and pink multi-color emphasis for varied presentation options. Each chart includes editable text areas below for item labels and descriptions.
Related Products
-

Continental Analysis Bar Graph – Enhance Market Competitiveness
#Market and Competitor Analysis #Graph #Other
-

Country Analysis Map Graph for Market Insights
#Market and Competitor Analysis #Marketing Plan and Strategy #Graph
-

User Analysis Graph by Age Group – Advanced Data Insights
#Market and Competitor Analysis #Diagram #Graph
-

Sailing Travel Project Expected Return on Investment Design Chart
#Product/Service Introduction #Financial Plans and Performance #Graph
