Newspaper Wide PowerPoint Template Donut Chart
RJ0200046_6
- Last Update 04/11/2025
- File Size 0.3MB
- # of Slides 2
- File Format PPTX
- Slide Ratio 16:9
- Color
Keywords
- #Content-Based Slides
- #Design-Based Slides
- #Business Vision and Strategy
- #Business Strategy
- #Graph
- #Business Goals
- #Circles
- #Doughnut Chart
- #Project Progress
- #16:9
- #donut chart PowerPoint slide
- #year-over-year comparison presentation
- #business progress chart
- #circular graph template
- #comparative analysis slides
About the Product
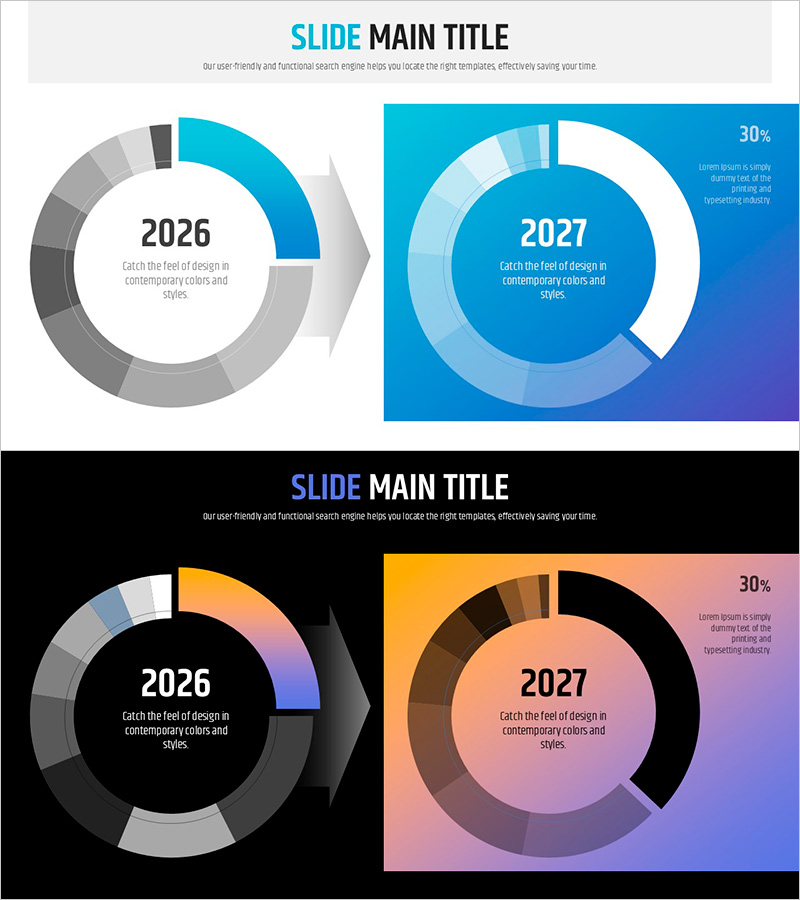
A PowerPoint slide featuring dual donut charts comparing business progress between 2026 and 2027. The template includes two color schemes: a blue gradient theme and an orange-to-pink gradient theme, each displaying annual metrics in the center circle with detailed breakdown segments in the outer ring. This presentation slide is ideal for tracking business advancement, year-over-year performance comparison, and goal achievement trends. The 2-slide set offers flexible color combinations to match corporate branding. Designed in 16:9 widescreen format for modern presentation environments.
Usage Points
-
Main Usage
Visually compare business metrics, performance indicators, and goal achievement rates across two fiscal years. The center circle displays the year label while the outer ring segments represent proportional data, enabling quick trend analysis at a glance.
-
How to Use
Apply to business progress reports, year-over-year performance presentations, and goal-versus-actual analysis slides. Select the preferred color theme to align with corporate branding, then edit the center text and outer ring values to input your actual data.
-
Recommended For
Business managers, executives, and project leads presenting annual progress reviews. Particularly effective for quarterly and annual performance reports, strategic planning meetings, and data-driven decision-making sessions where year-to-year comparisons are essential.
-
Slide Structure
2-slide template with each slide featuring a center circle (year label) and outer ring segments (4-6 data categories). Slide 1 uses a blue gradient background; Slide 2 features an orange-to-pink gradient. A 30% text area in the upper right corner accommodates key metrics or explanatory notes.
Related Products
-

Journey to a Goal Slide – Emphasizing Business Strategy
#Business Vision and Strategy #Business Strategy #Diagram
-

Achievement of Marketing and Sales Performance – Market Analysis and Vision
#Business Vision and Strategy #Market and Competitor Analysis #Diagram
-

Educational Goals for Boosting Cognitive Thinking
#Business Vision and Strategy #Business Strategy #Diagram
-

Doughnut Chart Slide for Vehicle Demand Analysis
#Business Vision and Strategy #Technical Approach #Diagram
