Ingredient Mixed Graph for Market Status Visualization – Innovation and Results
RJ0800003_6
- Last Update 07/31/2025
- File Size 0.5MB
- # of Slides 2
- File Format PPTX
- Slide Ratio 16:9
- Color
Keywords
About the Product
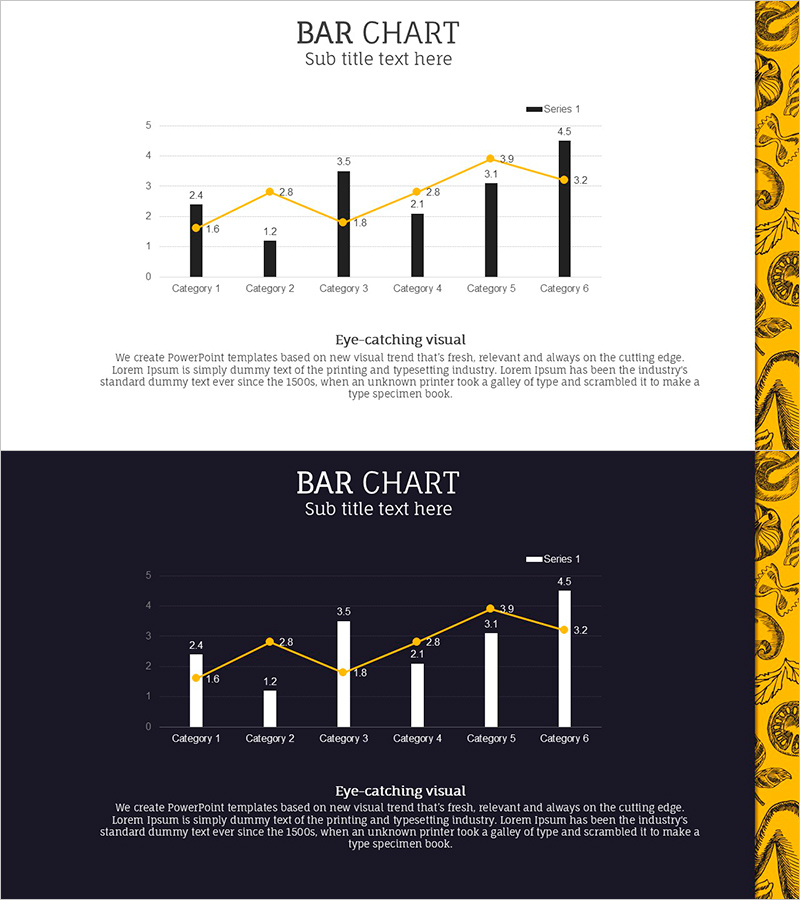
A PowerPoint slide that visualizes data across 6 categories using a combined bar and line chart design. Black bars represent primary values while an orange line tracks trends across categories, creating a dual-axis comparison effect. Two versions are included—light background and dark background—allowing you to match your presentation environment. Numerical labels appear above each data point for instant clarity. Perfect for market analysis, sales performance reports, quarterly results, and business intelligence presentations requiring simultaneous value and trend visualization.
Usage Points
-
Main Usage
This slide enables simultaneous comparison of multiple data series. The bar chart displays absolute values while the line chart reveals trends, allowing you to present both quantitative evidence and directional insights in a single visual. Commonly used for market status, sales metrics, performance indicators, and business intelligence reporting.
-
How to Use
Select either the light or dark background version based on your presentation venue and screen brightness. Replace the sample numerical values with your actual data, then update the title and legend as needed. The slide works seamlessly in investor pitches, executive briefings, quarterly reviews, and analytical presentations.
-
Recommended For
Recommended for finance professionals, marketing managers, sales directors, business analysts, and consultants who need to present data-driven insights. Ideal for CFOs, product managers, and strategy teams conducting performance reviews, market assessments, or competitive analysis.
-
Slide Structure
The slide contains a title section and a dedicated chart area. The chart displays 6 categories on the X-axis with a 0–5 numerical scale on the Y-axis. Each category shows a black bar (primary metric) and an orange line point (secondary metric). Below the chart is space for a headline and descriptive text to highlight key insights.
Related Products
-

Mockup and Area Charts Presentation Slide – Enhancing Market Analysis Clarity
#Market and Competitor Analysis #Financial Plans and Performance #Graph
-

Customer Rating Percentage Infographic Chart for Programs
#Product/Service Introduction #Market and Competitor Analysis #Graph
-

Mint Green Mixed Graph – Market Status Analysis
#Market and Competitor Analysis #Graph #Other
-

3 Market Share Analysis – Differentiated Market Strategy
#Market and Competitor Analysis #Graph #Other
