Core Technologies of AI Chipsets: Performance Characteristics
RJ0700029_4
- Last Update 07/30/2025
- File Size 4MB
- # of Slides 2
- File Format PPTX
- Slide Ratio 16:9
- Color
Keywords
- #Content-Based Slides
- #Design-Based Slides
- #Market and Competitor Analysis
- #Diagram
- #Graph
- #Other
- #Market Status
- #Industry Trends
- #Table
- #Standard Table
- #Vertical Table
- #16:9
- #circular progress chart PowerPoint
- #4-stage diagram slide template
- #circular gauge visualization
- #progress tracking presentation
- #problem analysis PowerPoint slide
About the Product
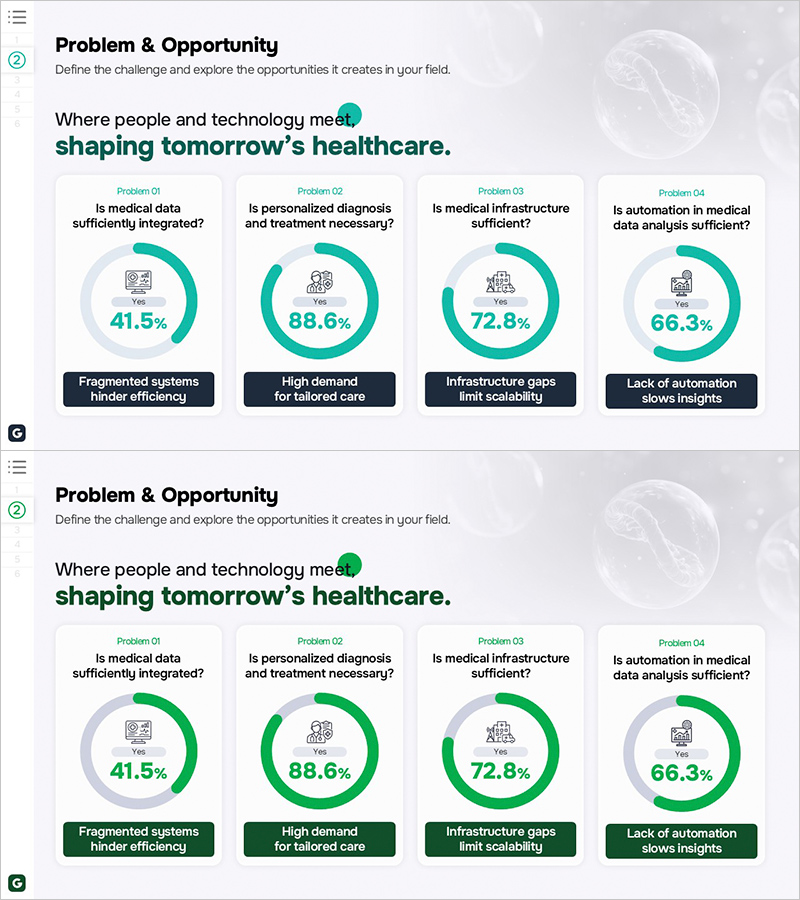
A PowerPoint slide featuring four circular progress charts designed to visualize problem definitions and solutions across four key areas. This presentation template is optimized for healthcare, technology, and business analytics presentations, displaying percentage metrics and key insights in a teal-colored gauge format. The circular chart layout with supporting text below each gauge enables data-driven decision-making presentations. The slide deck is formatted in 16:9 PPTX, ready for immediate editing and customization to match your organizational data.
Usage Points
-
Main Usage
This slide presents four key metrics or problem areas using circular progress charts with percentage indicators. Each gauge displays a specific challenge or status metric alongside a supporting message, enabling clear communication of multi-dimensional analysis. Suitable for healthcare technology assessment, infrastructure evaluation, diagnostic system reviews, and strategic problem-solving presentations.
-
How to Use
Replace the percentage values and labels in each circular chart with your actual organizational data. Edit the main title and supporting text below each gauge to align with your presentation context. Modify individual chart colors or adjust the gauge fill percentages independently. All chart elements are fully editable shapes compatible with standard PowerPoint editing tools.
-
Recommended For
Executive briefings, strategic planning meetings, market analysis presentations, technology assessment reports, and organizational diagnostic reviews. Ideal for healthcare, IT, manufacturing, and financial sectors requiring data-driven decision-making frameworks and multi-factor problem analysis.
-
Slide Structure
Two-slide layout with the first slide displaying four teal-colored circular progress charts arranged in a 2×2 grid, each with supporting text below. The second slide provides a color variation using green-toned gauges for design flexibility. All circular chart elements are independently editable shapes with customizable percentages and labels.
Related Products
-

Market Trend Analysis Graph – Sleek and Stylish Design
#Market and Competitor Analysis #Diagram #Graph
-

Area Graph & Notebook Mockup for Market Trend Analysis
#Market and Competitor Analysis #Graph #Other
-

Mixed Bar Graph for Market Analysis – Trends and Opportunities
#Market and Competitor Analysis #Graph #Other
-

Industrial Data Report for Market Analysis Slides
#Market and Competitor Analysis #Diagram #Graph
