Pizza and Competition Graph – Market Analysis Essential
RJ0800003_28
- Last Update 07/31/2025
- File Size 0.9MB
- # of Slides 2
- File Format PPTX
- Slide Ratio 16:9
- Color
Keywords
About the Product
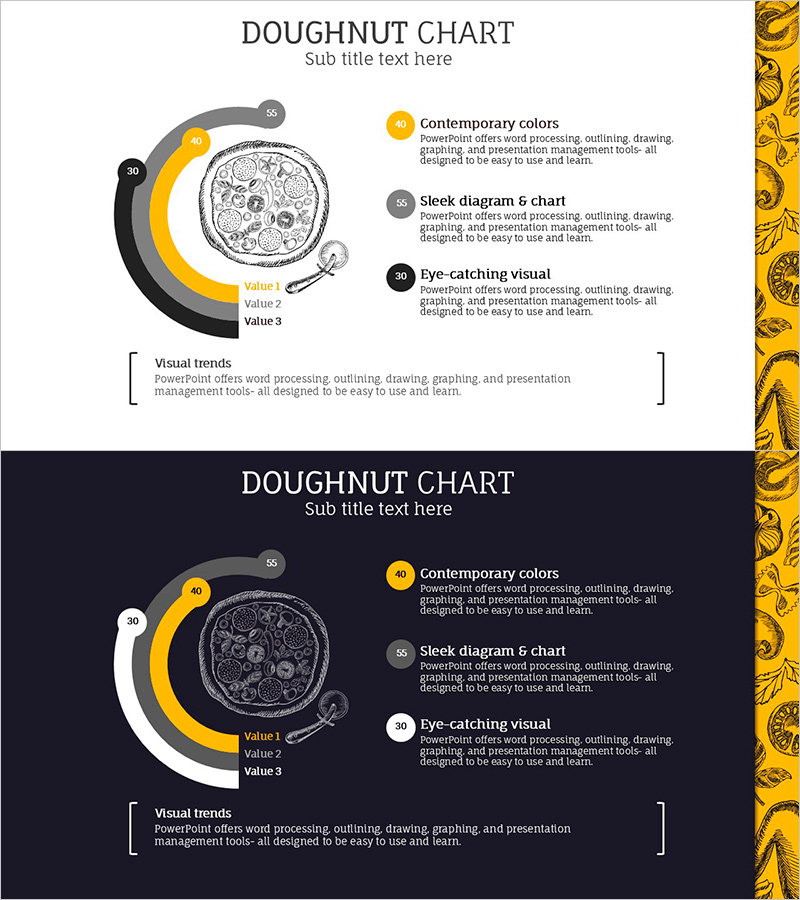
A 3-segment donut chart PowerPoint slide designed to visualize market analysis and competitive positioning. The concentric ring structure uses yellow, gray, and black color schemes to display both primary and secondary data simultaneously. Each segment can be customized with values and labels to represent market share, competitor comparison, product composition ratios, and other analytical data. Two background versions—light and dark—are included to match any presentation environment. The 16:9 widescreen format with 2 slides is ready for immediate editing and deployment.
Usage Points
-
Main Usage
Effectively displays the relative size and proportion of three data categories simultaneously, ideal for market analysis, competitor benchmarking, and product portfolio composition. The concentric ring design enables hierarchical visualization of primary and supporting data, enhancing audience comprehension.
-
How to Use
Integrate into business plans, marketing strategy documents, and investor pitch decks within the market analysis section. Edit segment values and labels with actual data, and adjust colors to align with corporate branding guidelines and presentation themes.
-
Recommended For
Marketing professionals, business strategists, and executives preparing analytical reports. Suitable for all presentation scenarios requiring ratio-based data comparison, including market assessment, competitive strategy development, and product portfolio overview.
-
Slide Structure
Two slides with concentric donut charts centered on each layout, accompanied by legend and descriptive text areas on the right. First slide features a light background (white), second slide uses a dark background (black) for flexible theme selection based on presentation context.
Related Products
-

Visualization of War Equipment Penetration Rate – Market Share Analysis
#Market and Competitor Analysis #Graph #Market Share
-

Watercolor Customer Analysis Donut Chart – Visualizing Market Share
#Market and Competitor Analysis #Graph #Market Share
-

Current Status of Space Business Visualized with Donut Chart - Competitive Edge Analysis
#Market and Competitor Analysis #Graph #Competitor Analysis
-

Core Transport Competitiveness Analysis – Intuitive Visualization with Graphs
#Market and Competitor Analysis #Graph #Competitor Analysis
