Analysis of Fish and Fruit Intake – Market Status and Performance
RJ0800002_6
- Last Update 07/31/2025
- File Size 1MB
- # of Slides 2
- File Format PPTX
- Slide Ratio 16:9
- Color
Keywords
- #Content-Based Slides
- #Design-Based Slides
- #Market and Competitor Analysis
- #Financial Plans and Performance
- #Graph
- #Market Status
- #Sales and Revenue
- #Horizontal Bar
- #Segmented Horizontal Bar
- #16:9
- #horizontal bar chart PowerPoint
- #data comparison slide template
- #market analysis chart
- #performance presentation
- #how to create bar chart in PowerPoint
About the Product
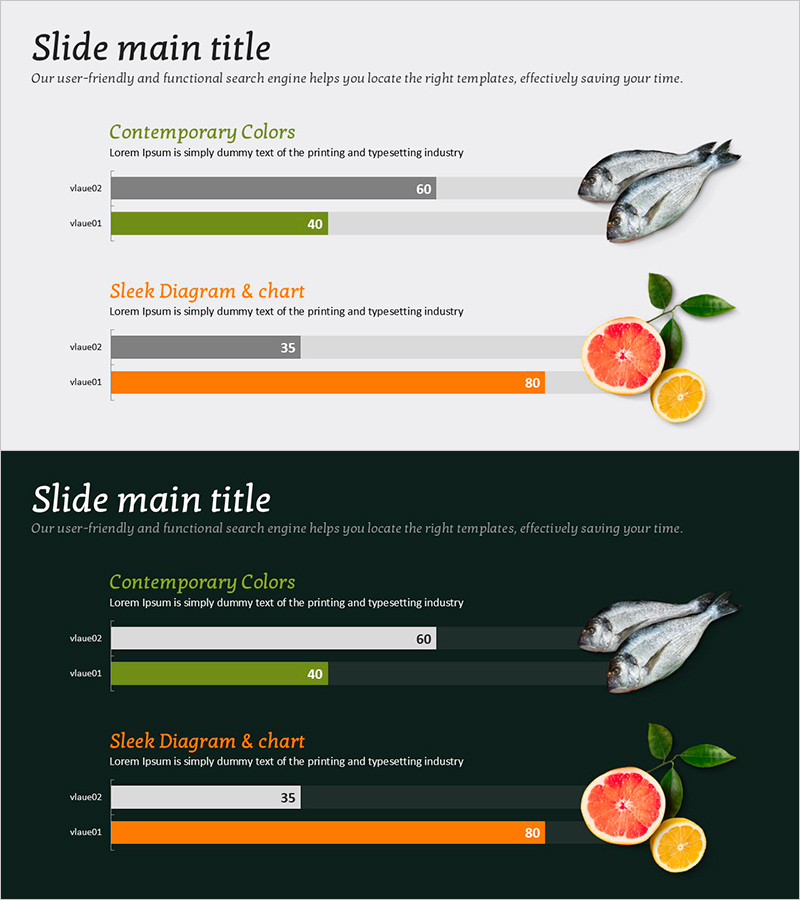
A horizontal bar chart PowerPoint slide designed for analyzing fish and fruit intake data with market status and performance comparison. The chart features two data series in gray and orange colors, enabling clear visual comparison of metrics across categories. Each bar displays numerical values for precise data communication in presentations and reports. Provided in 16:9 widescreen PPTX format with fully editable colors and data values for immediate use in business documents.
Usage Points
-
Main Usage
Effectively communicate quantitative information such as market analysis, product performance comparison, and consumption data visualization. The side-by-side bar arrangement allows immediate comparison of differences across items, while numerical labels ensure accurate data representation.
-
How to Use
Ideal for market analysis sections in reports, performance comparison pages in business plans, and consumer analysis portions in marketing presentations. Simply input your data and adjust bar lengths and values to create presentation-ready slides instantly.
-
Recommended For
Marketing professionals, data analysts, business executives, and market research specialists who need to present quantitative comparisons. Effective for comparing consumption trends, sales performance, market share, and competitive analysis.
-
Slide Structure
2-slide set featuring horizontal bar charts with 2 data series (gray and orange) on each slide. Layout includes section title and descriptive text at top, with fish and fruit imagery positioned on the right for visual balance. Numerical labels on each bar enhance data readability and professional presentation.
Related Products
-

Bar Graph Visualization of Pet Data
#Market and Competitor Analysis #Financial Plans and Performance #Graph
-

Rainbow Presentation Template Bilateral Bar Graph – Market Status and Financial Analysis
#Market and Competitor Analysis #Financial Plans and Performance #Graph
-

Volume Template for Horizontal Bar Chart – Market Status and Competitive Edge
#Market and Competitor Analysis #Graph #Market Status
-

Potted Doughnut Chart for Market Analysis – Performance vs Sales
#Market and Competitor Analysis #Financial Plans and Performance #Graph
