Visualizing Market Share with Pie Chart – Successful Investment Planning
RJ0200001_17
- Last Update 03/28/2025
- File Size 0.1MB
- # of Slides 2
- File Format PPTX
- Slide Ratio 16:9
- Color
Keywords
- #Content-Based Slides
- #Design-Based Slides
- #Market and Competitor Analysis
- #Financial Plans and Performance
- #Graph
- #Market Share
- #Projected Return on Investment (ROI)
- #Circles
- #Pie Chart
- #16:9
- #pie chart PowerPoint slide
- #pie graph presentation
- #market share visualization
- #ratio analysis slide
- #financial data chart
- #investment return graph
About the Product
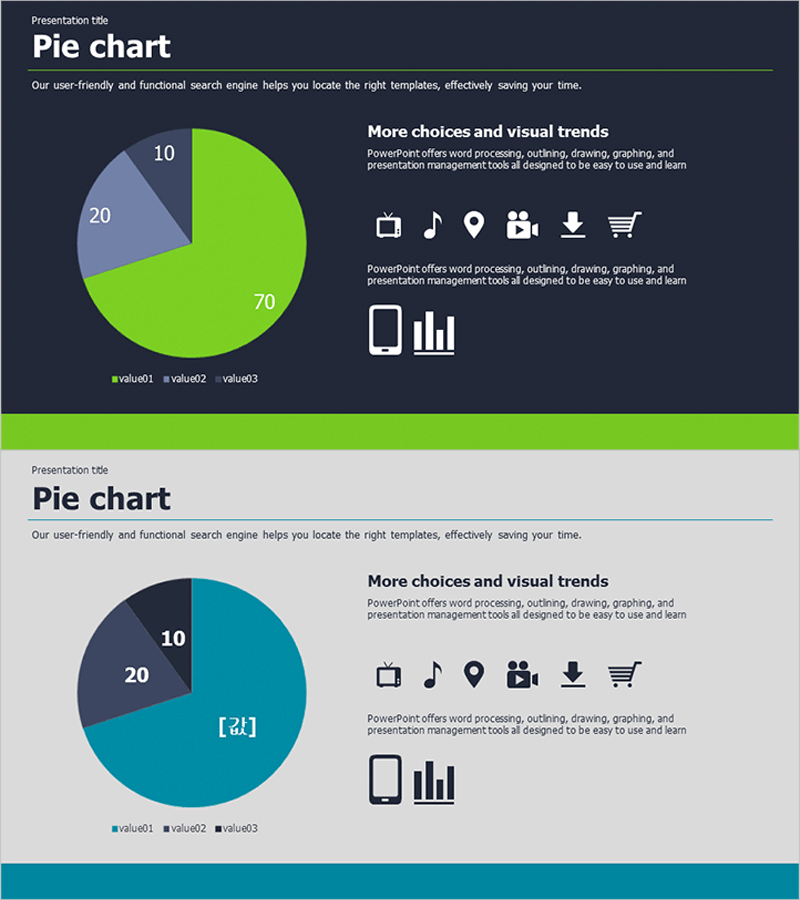
A three-segment pie chart PowerPoint slide designed to clearly express market share and investment returns. The dark background combined with lime green and slate blue colors creates strong visual contrast that intuitively communicates data proportions. The 2-slide set accommodates various ratio datasets and is ready for immediate use in financial reports, investment plans, and business analysis presentations. Optimized in 16:9 widescreen format for modern presentation environments.
Usage Points
-
Main Usage
Clearly communicates proportional relationships between parts and whole, such as investment ROI, market share, and revenue composition. The three-segment design enables instant comprehension of relative differences, making it highly effective for financial analysis, business performance reporting, and marketing status presentations.
-
How to Use
Simply input values and labels into each segment for immediate use. Two design versions are provided—dark background and light background—allowing you to match your presentation environment and document tone. Colors and numerical values are fully editable to suit your data.
-
Recommended For
Recommended for finance teams, investment managers, executives preparing reports, marketing analysts, and business plan presenters. Particularly useful for quarterly performance reports, investor pitch decks, and business outcome analysis presentations.
-
Slide Structure
Pie chart divided into three segments with distinct colors. Each segment is clearly labeled with numerical values and a legend. Two design variations provided: dark background version (lime green 70%, slate blue 20%, gray 10%) and light background version (teal-dominant color scheme).
Related Products
-

Avocado and Strawberry Pie Chart – Market Share Analysis
#Market and Competitor Analysis #Financial Plans and Performance #Graph
-

Red Green Mockup Chart - Visualizing Investment Returns
#Financial Plans and Performance #Graph #Other
-

Age-based Market Share Analysis with Pie Chart
#Market and Competitor Analysis #Graph #Market Share
-

Medical Development Status Pie Chart – Visualizing Market Share
#Product/Service Introduction #Market and Competitor Analysis #Graph
