Green Red Radial Chart Analysis – Innovation in Data Visualization
RJ0800001_28
- Last Update 07/31/2025
- File Size 0.4MB
- # of Slides 2
- File Format PPTX
- Slide Ratio 16:9
- Color
Keywords
About the Product
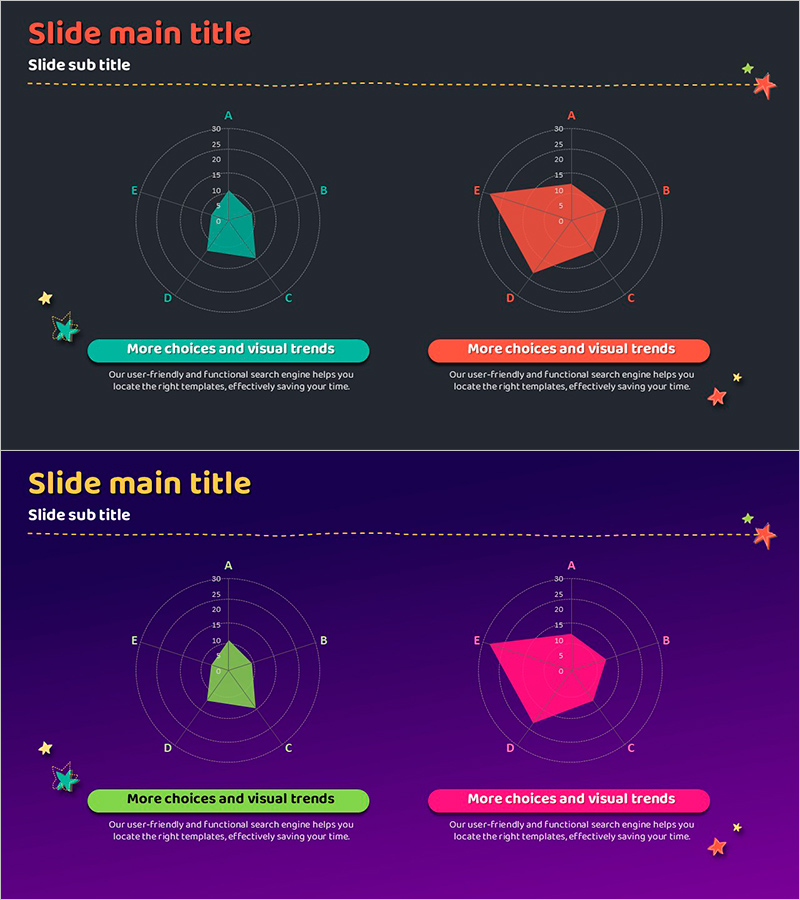
A PowerPoint slide featuring a 5-axis radial diagram that visualizes multiple data series side by side using green and red dual-tone colors. Two pentagon-shaped data plots are overlaid on concentric circular grids, allowing direct comparison of five metrics across two categories (e.g., target vs. actual, team A vs. team B, current vs. goal). The 2-slide set presents the same data structure with different color combinations, making it ideal for performance reviews, capability assessments, competitive analysis, and KPI dashboards. Optimized for 16:9 widescreen format in fully editable PPTX.
Usage Points
-
Main Usage
Displays five metrics across two data series using a radial (radar) chart format, enabling simultaneous comparison of values and identification of strengths and weaknesses. The dual-tone color scheme (green vs. red) creates visual contrast between two categories, making differences immediately apparent to audiences.
-
How to Use
Insert into business presentations during performance reporting, capability assessment, competitive benchmarking, or product feature comparison sections. Edit the concentric grid values and pentagon shapes to input your data, and adjust colors to match your presentation theme or to emphasize different comparison scenarios.
-
Recommended For
Ideal for executives, business analysts, marketing professionals, HR specialists, and product managers preparing performance dashboards, competitive analysis reports, team capability assessments, product positioning slides, and KPI reviews.
-
Slide Structure
2-slide set. Each slide contains a 5-axis radial grid (axes labeled A, B, C, D, E) with two overlapping pentagon-shaped data polygons. Slide 1 uses green and red; Slide 2 uses green and pink. Both maintain identical data structure, allowing flexible color selection based on presentation context.
Related Products
-

Comparable Filled Radial Chart – Intuitive Data Analysis
#Product/Service Introduction #Market and Competitor Analysis #Diagram
-

Blue Radar Chart Analysis – Insights for Products and Services
#Product/Service Introduction #Graph #Features
-

Radar Chart Slide Visualizing Crime Data
#Product/Service Introduction #Business Vision and Strategy #Graph
-

Fantastic Wide PPT Radar Chart – Visualizing Product Features and Benefits
#Product/Service Introduction #Graph #Product/Service Introduction
