Competency Radar Chart – Business Vision and Strategy Introduction
RB0800001_15
- Last Update 03/17/2025
- File Size 0.5MB
- # of Slides 2
- File Format PPTX
- Slide Ratio 4:3
- Color
Keywords
- #Content-Based Slides
- #Design-Based Slides
- #Product/Service Introduction
- #Business Vision and Strategy
- #Graph
- #Features
- #Core Competencies
- #Other
- #Radar Chart Spider Chart
- #4:3
- #radial radar chart PowerPoint
- #competency assessment slide template
- #5-axis radar diagram
- #business vision chart
- #strategic competency visualization
About the Product
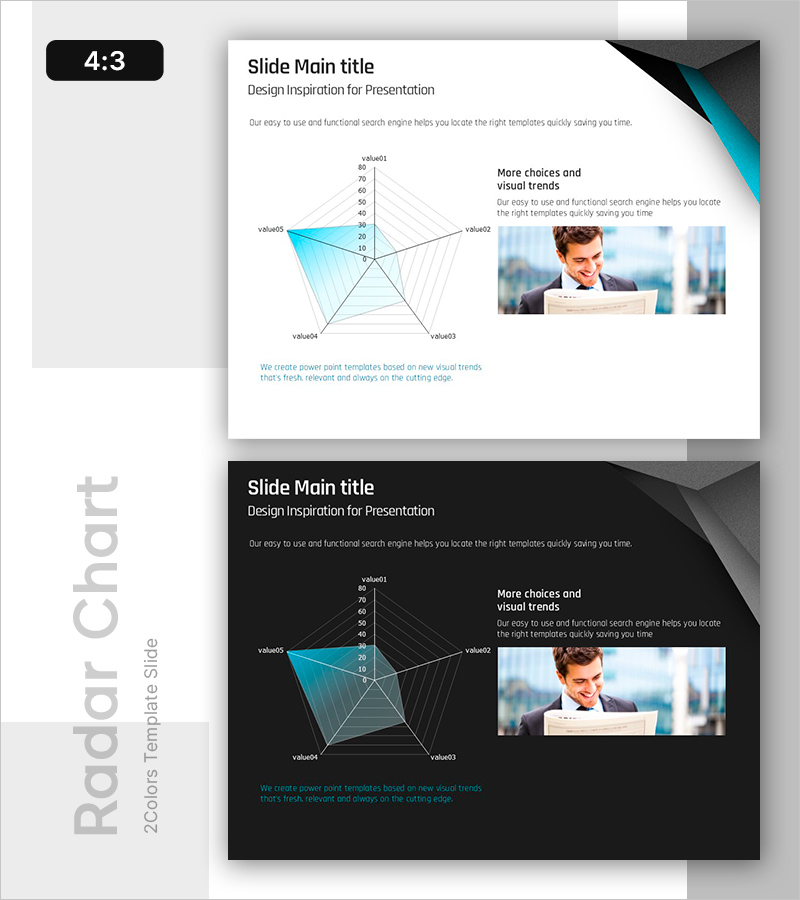
A PowerPoint slide featuring a 5-axis radial radar chart that visualizes competency levels across five dimensions. The design uses teal gradient fill with white grid lines to clearly represent data comparisons. This presentation template is ideal for business vision statements, strategic planning, and competency assessments, enabling stakeholders to grasp organizational strengths and development areas at a glance. The 4:3 aspect ratio includes 2 slides with both light and dark background versions, allowing you to select the appropriate design for any presentation environment.
Usage Points
-
Main Usage
Visualizes five key organizational or individual competencies (such as leadership, technical expertise, creativity, execution capability, and communication skills) in a radial layout, simultaneously highlighting strengths and development areas. Commonly used in executive meetings, HR performance reviews, and organizational development strategy presentations.
-
How to Use
Replace each axis label (value01 through value05) with your competency names and input data values within the 0–80 range; the chart updates automatically. Use the light background slide for printed materials and the dark background version for screen presentations.
-
Recommended For
Executives, HR professionals, organizational development teams, management consultants, and training facilitators. Recommended for those supporting data-driven decision-making in business strategy development, organizational capability assessment, talent development planning, and performance evaluation presentations.
-
Slide Structure
A 5-axis radial radar chart with five lines extending from the center outward and concentric grid circles (0, 20, 40, 60, 80) marking data intervals. A teal semi-transparent area indicates the data range, while a text box labeled 'More choices and visual trends' and a business professional image are positioned on the right to provide contextual reinforcement.
Related Products
-

Radar Chart Slide Visualizing Crime Data
#Product/Service Introduction #Business Vision and Strategy #Graph
-

Visualizing Core Competence with Circular Piece Diagram – Business Vision and Strategy
#Product/Service Introduction #Business Vision and Strategy #Diagram
-

Key Core Competency Circular Diagram – Business Vision and Strategy
#Product/Service Introduction #Business Vision and Strategy #Diagram
-

Hexagonal Solid Overlapping Diagram – Business Vision and Strategies
#Product/Service Introduction #Business Vision and Strategy #Diagram
